Introduction
One of the very first posts on this site introduced the basics of Absorption Spectroscopy and the concepts of Absorbance and Transmittance of light through homogeneous materials. In this article we are going to consider this topic in a little more detail through the Beer-Lambert law and use the relationship to determine the concentration of a test sample in solution.
Background
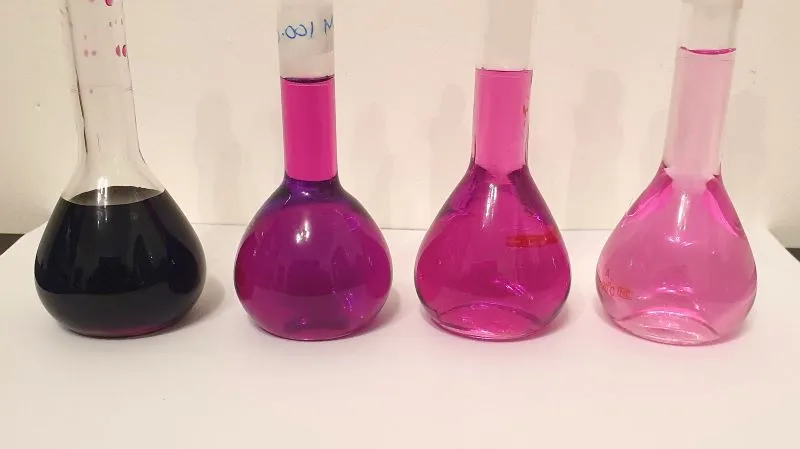
The collision of a UV or visible photon with a molecule results in the absorption of light. It follows that if a greater number of molecules are placed in the path of the light beam, then there will be a greater chance of a collision occurring and therefore of absorption. Our everyday experience knows this to be true intuitively. Think of a glass of some blackcurrant drink. The drink appears purple since we know that certain wavelengths are absorbed whilst others are transmitted and pass through the solution. And we know that it is this that gives the drink its characteristic colour.
Now if we hold a second glass of the drink behind the first, the colour appears twice as intense. We know that less light is able to pass through the two glasses than the one alone. It is clear that the probability of a collision between a photon and the light absorbing molecule has increased. By the same argument, we know that if we dilute the drink its colour intensity will decrease because we have reduced the concentration of the absorbing molecules. In this situation, we have decreased the probability of a photon colliding with the light absorbing species.
The Beer-Lambert Law
When applied to chemical analysis to determine the concentration of a chemical species in solution (often referred to as the analyte), this drop in light intensity is expressed by an empirical law called the Beer-Lambert law. In physics, this law is referred to as the Bouguer-Lambert law and describes the much more general case of the attenuation of light of any wavelength passing through any material, not just a pure solution exposed to UV or visible light.
But for now, we are concentrating on some chemical examples. More detailed information is provided here.)
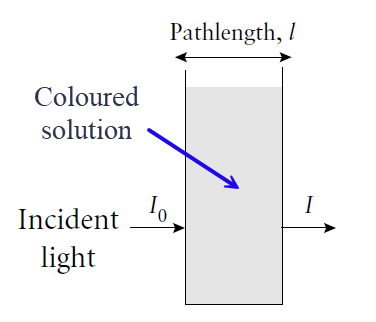
The Beer-Lambert law is an absorption law. It relates the amount of absorption of molecules in solution to the concentration (c) of the analyte in solution, to the path length (l) that the beam traverses, and a proportionality term called the extinction coefficient or absorptivity, labelled ε. The amount of absorption is termed the Absorbance A, and Beer-Lambert expression is given by

Absorbance (historically called the optical density) is a dimensionless quantity since it is defined as the log10 of the ratio of incident light entering the sample divided by the transmitted light intensity.
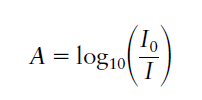
where I0 and I are the incident light and transmitted light intensities respectively. In the analytical laboratory, the concentration c is usually expressed in moles per litre (mol l-1), the path length l is in cm and ε is then referred to as the molar extinction coefficient with units of l mol-1 cm-1.
The Beer–Lambert law is one of the most widely used relationships in analytical chemistry and is at the heart of the majority of UV and visible quantitative analyses. Very often the objective is to determine the concentration of an unknown sample and this will be demonstrated below.
Experimental
The linear relationship between absorption and path length in the Beer-Lambert law holds in many cases. However, for solute concentrations greater than about 0.01M (where M means Molar or moles per litre), deviations from linearity do occur. As such, the Beer-Lambert law is a limiting law. At high concentrations, solute-solvent interactions, solute-solute interactions and hydrogen bonding can affect the chemical environment of the analyte and its absorptivity. Thus the law should only be applied for fairly dilute solutions. For the most part, solution concentrations of up to about 0.01M do obey the law in most instances.
So the first step is to verify the applicability of the law before proceeding. We prepare a series of standard solutions of precisely known concentration and check if the relationship is valid.
Classroom demonstrations of the Beer Lambert law use a spectrophotometer to measure the absorbance A, and often employ brightly coloured aqueous solutions of compounds for students to appreciate the principles. But the law applies equally well to colourless solutions that absorb in the UV, not just the visible as well as solutions of fluorescent compounds.
Two popular visual examples use copper sulphate (CuSO4) and potassium permanganate, (KMnO4). Both compounds produce intense colours in aqueous solution, especially KMNO4 due to its strongly absorbing permanganate anion MnO4–. In this demonstration, we will use KMnO4.
The molecular weight of KMnO4 is 158 g/mol. A reference solution of 0.01M KMnO4 in water was first prepared. This stock solution was then progressively diluted to make solutions with exact concentrations of 0.001M, 0.0008M, 0.0004M, 0.0001M and 0.00005M.
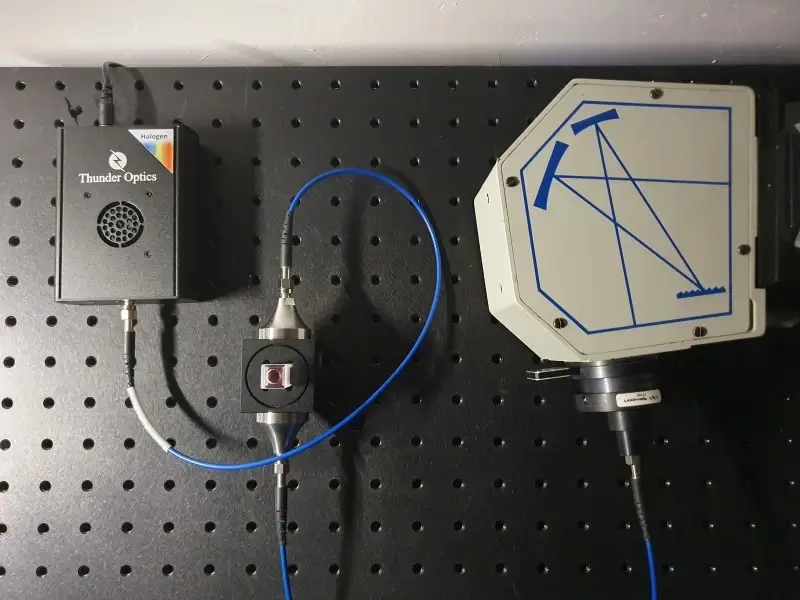
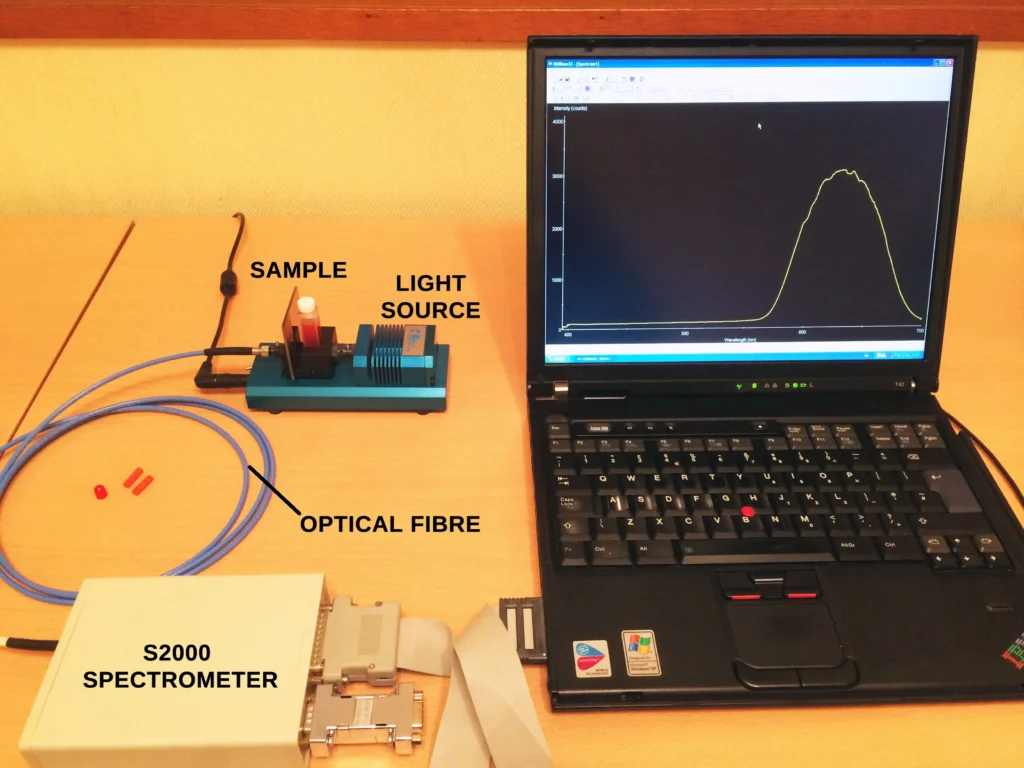
The absorption spectra of these reference solutions were then recorded using the experimental setup shown below. The light source is a tungsten halogen lamp from Thunder Optics, kindly offered to me by CEO Dr. Amayas Mostefaoui. The spectrometer is an Oriel MS125 1/8m grating spectrograph and 200 and 400 micron optical fibres are used to connect the different components.
The spectra recorded are in absorbance units. In order to achieve this, a dark spectrum is recorded first and saved in the software (Spectragryph). This is where the light source is blocked and no light reaches the detector. Then a reference or blank spectrum is recorded and saved: this is a sample of pure solvent only; water in this case. Finally, the actual sample spectrum is recorded. The software then automatically produces the final spectrum in units of absorbance versus wavelength.
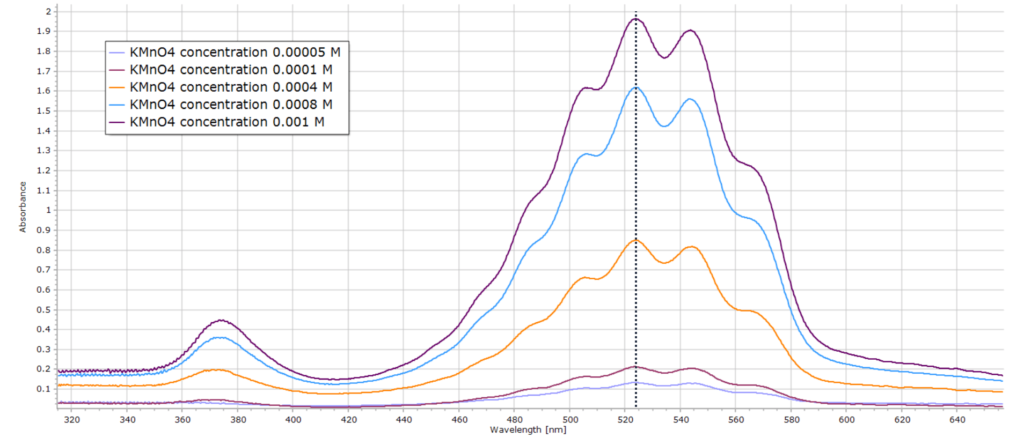
The results are shown here for the series of standard permanganate solutions:
In order to check the validity of the Beer-Lambert law, we note the absorbance values for each sample at a given wavelength. Usually the peak maximum (λmax) for each sample is selected to minimize error. This is the vertical dotted line in the spectral series above at 524 nm.
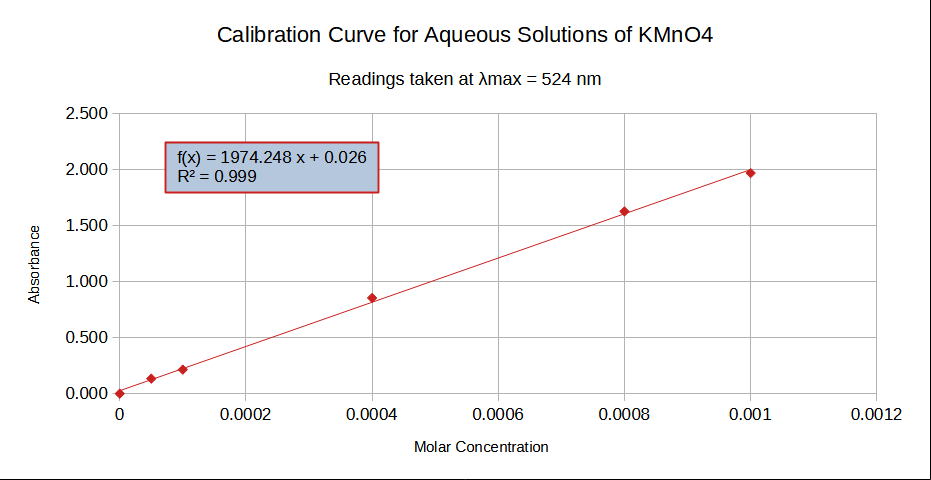
Plotting absorbance value as a function of sample concentration produces the calibration curve and is shown below. This produces a straight line, therefore confirming the validity of the Beer-Lambert law for this range of concentrations. Performing a regression analysis on the data points yield the equation of the line and the correlation coefficient R2. The latter should be a number very close to one, 0.9989 in this case.
Analysis of an Unknown Sample
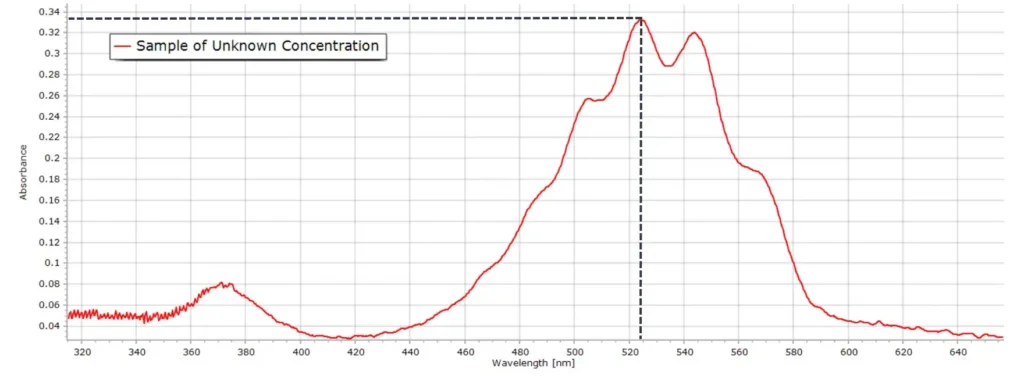
Having demonstrated that the Beer-Lambert law is obeyed, we can now determine the concentration of any unknown sample within this range of concentrations. We record the absorption spectrum of this test solution and read the concentration from the calibration curve.
As an example, an arbitrary sample was made up whose concentration was unknown. The absorption spectrum was then recorded. At the same wavelength maximum of 524 nm, the absorbance reading is 0.334 and from the calibration curve, this corresponds to a permanganate molar concentration c = 1.56 x 10⁻⁴ M.
Final Words...
UV-Visible absorption spectrophotometry is perhaps the most ubiquitous and most frequently used spectroscopic technique in the analytical testing laboratory. The method is used routinely in many industrial sectors. Moreover, modern instruments can do much more than just calculating the concentration of samples, as described in this simple demonstration.
But with some simple equipment (a white light source, a small spectrometer, a couple of optical fibres and some simple lab glassware) the home experimenter can demonstrate this extremely important method of analysis that is employed regularly in professional laboratories and institutions.
