Introduction
Quite a few articles on this site have looked at atomic and molecular spectra in the UV and visible regions of the electromagnetic spectrum, in emission, absorption and even reflection. In this article we are going to move on and look at a different region: the infrared or IR.
IR spectroscopy (which is also known as vibrational spectroscopy) involves the measurement of the interaction of infrared radiation (heat) with matter by absorption, emission or reflection, much in the same way as visible light. In chemistry, IR spectroscopy is a hugely important field of study because this region is where the fundamental vibrations of many organic molecules occur and a large number of substances can be studied and identified from their IR spectra.
In the research and industrial lab, infrared spectroscopic techniques are most often carried out with an instrument called an IR spectrometer or spectrophotometer. The most common setup for the spectrometer is to record the absorption of radiation by a sample. As with UV and visible methods, a source of IR radiation (a heat source) is built directly into the instrument.
IR instruments have evolved significantly over the last 50 years. Therefore before going further it is instructive to consider briefly the history of this spectrometer and how it has changed and improved over time. At the same time I will combine and recount my own personal experience, to some extent, as a young chemistry student discovering the IR spectrometer for the very first time.
IR Spectrometers - Historical Development
It is fair to say that the first IR spectrometers were developed by US researchers in the mid 1940’s, although the theoretical principles of infrared spectroscopy, linking vibrating molecules to infrared absorption, date back earlier to the 1920’s.
I first met an infrared spectrometer as a chemistry undergraduate in the early 1970’s. This gives you some idea of my age today as a retired chemist, after spending a career in industrial R&D. I still enjoy playing around with second hand and refurbished spectroscopic equipment of various kinds in my home lab, as you can read elsewhere in the articles on this site.
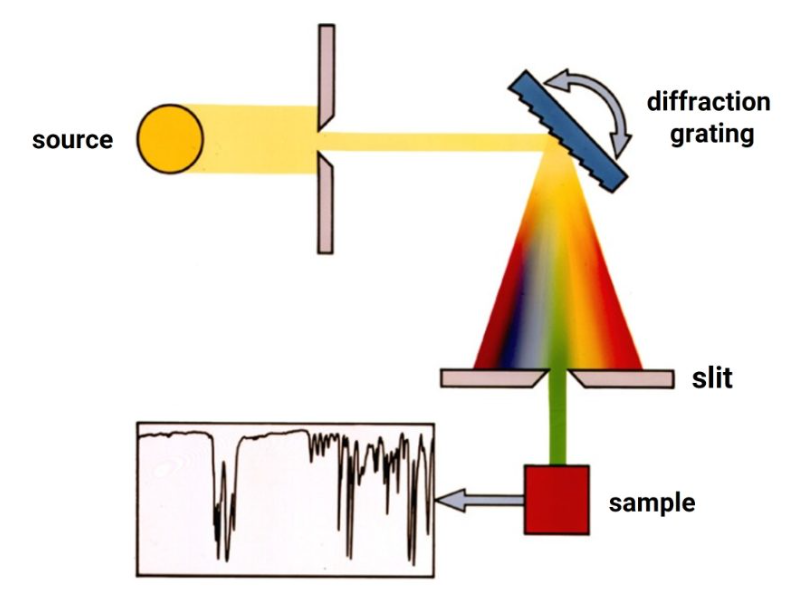
Early IR spectrometers were based on an entirely similar configuration to their optical counterpart in the visible. In other words, they had some form of light source emitting in the IR, a grating monochromator to disperse the light after passing through a sample, and some type of detector that is sensitive in the infrared. Instruments of this kind are generally termed dispersive spectrometers because transmitted infrared light passing through a sample is dispersed by a diffraction grating, splitting it into the different wavelengths, and these wavelengths are sequentially detected by a thermocouple or bolometer.
In 1957, the Perkin Elmer company in the USA introduced the first low-cost IR spectrophotometer, the Infracord Model 137, priced at just $3800.
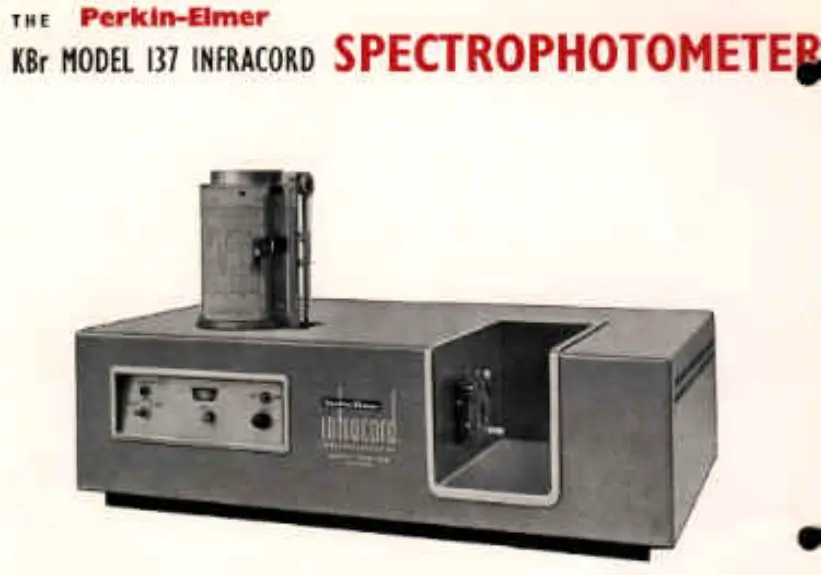
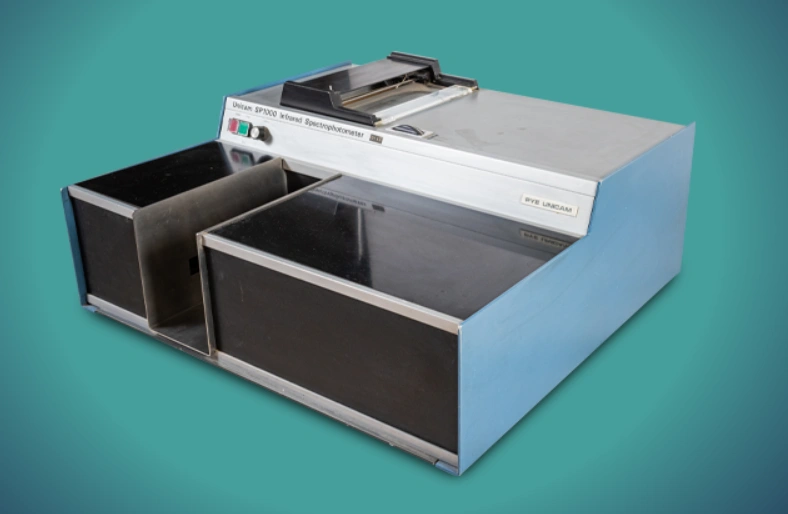
IR spectrometers of this period occupied a sizable proportion of the laboratory bench, as did their optical counterparts operating in the UV and visible regions of the spectrum. The Infracord 137, together with its successors, became the market leader in IR spectrometers in the USA through the 1960’s and 1970’s for research and teaching. But the competition was not far behind, and a popular instrument in UK university labs during the 70’s was the Pye Unicam SP200 pictured below.
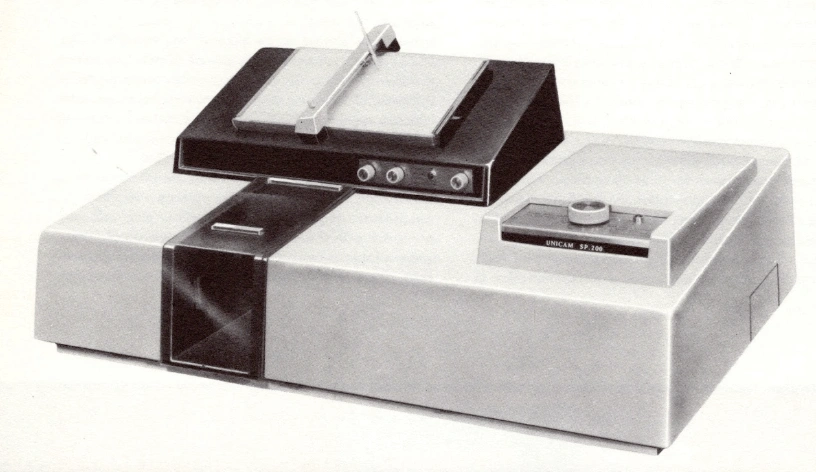
The SP200 was an “economy” version of a higher specification, more research-oriented model called the SP100. I suppose the 200 was considered to be more suitable for use in undergraduate teaching labs and it was also easier to operate. The SP200 was to be a close companion of mine during my early years in chemistry lab classes.
Preparing a Sample
Sample preparation for IR spectroscopy is somewhat more complex than UV-visible spectrophotometry. With UV-visible experiments, one simply makes up a solution of the sample, adds a few mL of the solution to a 1 cm cuvette, the cuvette is placed in the instrument and a button pressed to start a scan.
With infrared work, however, getting a usable IR spectrum at this time did come with its practical challenges. Liquids were not too much of a problem: A thin film of the liquid sample could be sandwiched between two thin plates of an IR-transparent material, typically potassium bromide (KBr). Provided the sample did not degrade or attack the KBr plates, that are very sensitive to moisture, a usable spectrum of the unknown liquid could be recorded.
Solid samples, on the other hand, sometimes proved to be more of a challenge. There were two main methods to prepare a solid sample for recording an IR spectrum at the time. These are in fact still in use today for some applications. The methods are the Nujol mull and the KBr disk. And we students of course were required to familiarize ourselves with both techniques.
A mull is a fine paste prepared by grinding a solid sample of the test material and mixing it intimately with Nujol – the brand name for a high purity paraffin oil that is a mixture of saturated hydrocarbons (alkanes). Nujol is not completely transparent in the infrared. But it possesses a relatively uncomplicated infrared spectrum, with well identified absorption peaks at certain frequencies (wavenumbers) that would hopefully not interfere with the sample spectrum. This Nujol paste was spread thinly between two plates of transparent KBr. The whole assembly was then inserted into a sample holder and the spectrum recorded. And it took around 10 slow minutes for the spectrum to be plotted, usually on a chart recorder, as shown in the above pictures.
Nujol mulls are still in use today for recording IR spectra, although their use has decreased in favour of much quicker and simpler sampling methods (much more about that in part 2 of this article).
And then there’s the KBr disk, which could be your enemy or your friend! As mentioned above, KBr is totally transparent in the mid-IR region of the spectrum where many compounds of interest produce IR spectra. By convention the mid-IR wavelength range is from 2.5 to 50 microns (4000 cm-1 to 400 cm-1). KBr is an ideal material to use as a matrix for solid test samples. However, achieving a good KBr disk that would produce a usable spectrum seemed more akin to an art than a science to us inexperienced student chemists!
Preparing a disk involved taking a small quantity of the sample, mixing it intimately with KBr by grinding the two solids together in an agate mortar. The mixture was then inserted into a small die and the “correct” pressure applied to compress the mixture into a thin disk. Finally, upon unscrewing the die, out popped your KBr disk.
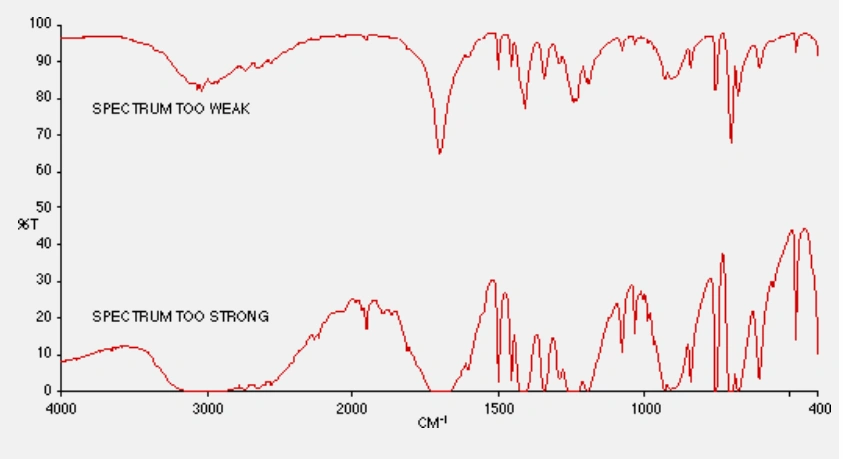
The critical part was getting the proportions right. If you had too little sample in the mixture the resulting spectrum was too weak in intensity and any key identifying IR absorption bands would be lost. Too much sample and the bands would be saturated and the spectrum uninterpretable. Moreover, if the “correct” pressure was not applied to the die, the disk could simply crumble and fall apart as you removed it from the press. Believe me, I know, I’ve been there!
These effects are shown in the IR spectra below, using the compound phenyl acetic acid as a example:
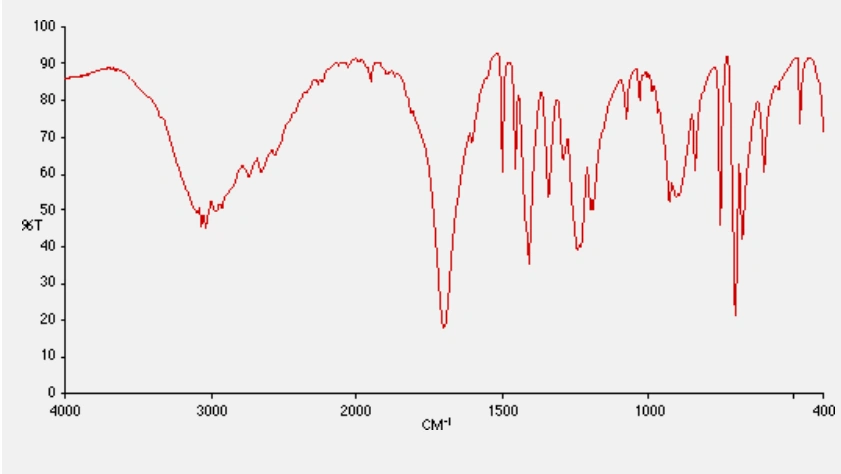
Eventually, after some practice, and a little gained experience, a workable KBr disk could be achieved, and we students breathed a sigh of relief as we observed a usable spectrum of our sample slowly appearing on the chart recorder.
Interpreting the Spectrum
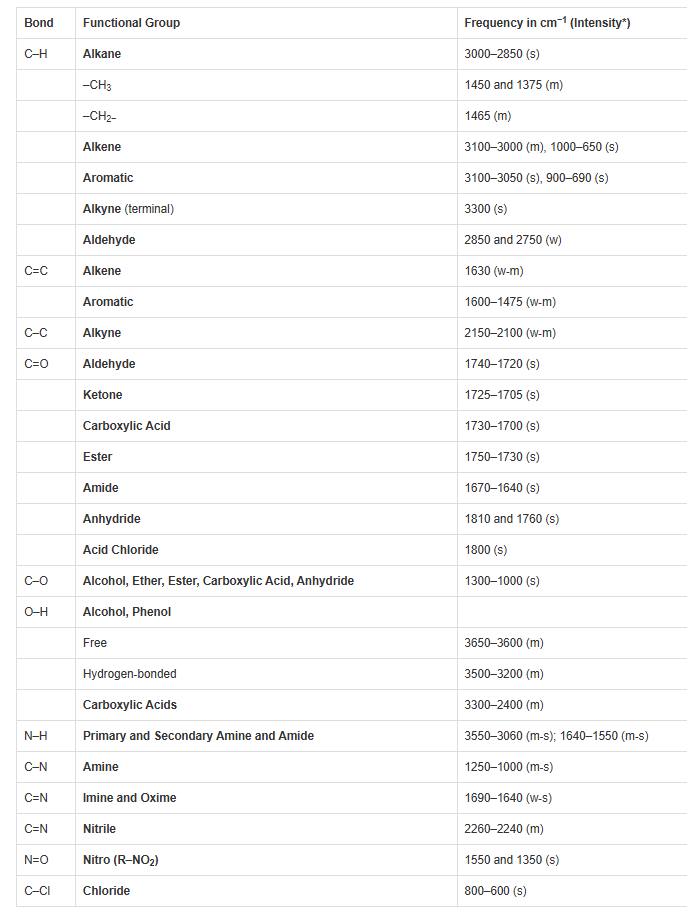
Once we had our spectrum, the usual lab assignment we faced was identifying the unknown compound. Today, this is done very easily with computer software searching online IR spectral libraries. But back then, we had to search through endless pages of “standard” spectra in heavy atlases displaying so-called standard IR spectra, in an attempt to identify our unknown compound. This could well be, and often was, a mixture of compounds. It was all part of the teaching and learning process, and with time we students came to recognize the various functional groups (basically portions of a larger vibrating molecule) that had characteristic frequencies (wavenumbers expressed in cm-1) in the infrared spectrum of an organic molecule.
An example of the frequencies of some of the common functional groups of organic molecules can be seen in the following table. The labels (s) (m) and (w) refer to the relative strengths of the absorption bands in a typical spectrum: strong, medium or weak.
The 1970’s decade turned out to be a pivotal period in the commercial development of the IR spectrometer: the Fourier Transform IR spectrometer (FTIR spectrometer) began to make an appearance. These instruments had previously been developed in research labs in the late sixties and the first commercial versions were introduced in the mid 70’s.
A description of the principles of operation of the FTIR spectrometer will form the basis of Part 2 of this article.