Introduction
In Part 1 of this article looked at the development of the dispersive infrared (IR) spectrometer employing a grating monochromator and slits. And the details of some sample preparation techniques were described from a somewhat personal perspective, growing up as I did as an undergraduate chemistry student in the 1970’s.
Here in Part 2, I want to move on to introduce a radical new instrumental development, when the world of infrared (IR) spectroscopy was to change considerably. In the 1970’s, and especially the 1980’s, I was to become familiar with these changes and new developments.
This technological change came with the introduction of the Fourier Transform IR spectrometer (FTIR spectrometer) in the late 1970’s. FTIR spectrometers, and the widespread commercialization and adoption of these radically new instruments in R&D and teaching labs in the 1980’s and then into the 1990’s, rapidly led to their widespread acceptance. It is no exaggeration to say that the Fourier Transform spectrometer caused a revolution in infrared spectroscopy in terms of the speed of acquisition of IR spectra and simplicity of operation.
With this in mind, it is worth spending some time on the details as to why this new way of recording and measuring infrared spectra became so popular.
The FTIR Spectrometer
If we want to be pedantic, the FTIR spectrometer is not a spectrometer at all. That’s right! The core optical component in the instrument is an interferometer. However, the final output from an FTIR, after computer software and data processing have done their work, is the familiar spectrum of a sample that we all know, with absorbance (or transmittance) plotted on the vertical axis of a spectrum and wavelength expressed in wavenumbers (cm-1) on the horizontal axis. Basically – just what we expect to see with any spectrum, regardless of wavelength region: signal as a function of wavelength. As a consequence, we almost always refer to this new instrument as an FTIR spectrometer, and not an interferometer.
Inside an FTIR Spectrometer
Almost all commercial FTIR spectrometers use the so-called Michelson configuration of an interferometer. A Michelson interferometer, as it is designed for a spectrometer for infrared studies, can be seen here in this schematic:
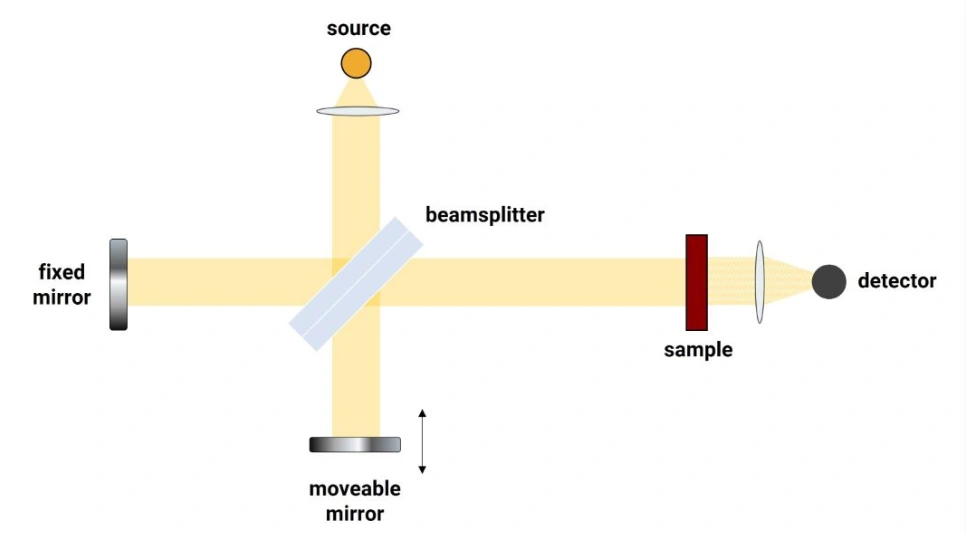
As the name implies, an interferometer is based on the concept of light interference. In an FTIR spectrometer, the interferometer causes IR light waves to interfere with each other.
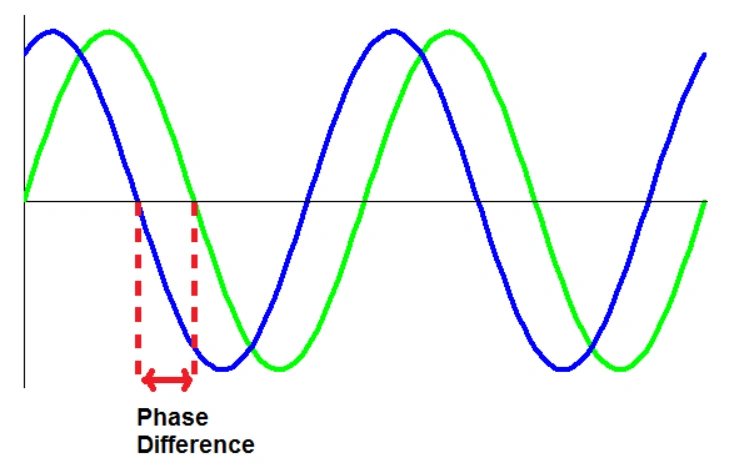
All electromagnetic waves move at the speed of light and consist of peaks and troughs. When the peaks and troughs of two waves are perfectly aligned, they are said to be in phase and constructive interference takes place. As a result the wave “signal” is amplified. When the peaks and troughs are completely unaligned, destructive interference occurs, the waves are completely out of phase, cancelling out each other, and the wave signal falls to zero.
At all conditions in between, the waves interact, and the degree of interaction depends on the phase difference between the two waves.
In the interferometer schematic (figure 1), a source of infrared radiation is split by a beamsplitter, one half of the light going to a fixed mirror and the other half transmitted through the splitter to a movable mirror. The beams are then reflected by both mirrors, back to the beamsplitter, where they recombine. Now if the two IR light waves travel exactly the same distance to the mirrors and back, they will be in phase upon recombination and produce constructive interference. The recombined beams are then directed to the sample under study and then detected.
The movable mirror is then moved ever so slightly, causing the two beams to travel very slightly different distances through the interferometer. This changes the phase difference between the two beam paths, resulting in a slightly different interference pattern when the beams recombine. Each interference pattern produced, as the movable mirror is displaced step by step each time, means that different wavelengths of infrared light are present in the recombined beam, which then pass through the sample and continue to the detector.
In practice, this all happens very fast, with the movable mirror stepping rapidly through different positions until all interference patterns have been collected and detected across the IR spectral range, typically from 2.5 to 25 micrometers (4000 cm-1 to 400 cm-1).
When all the interference data has been collected, the result is an interferogram of the sample under investigation, and resembles something like this:
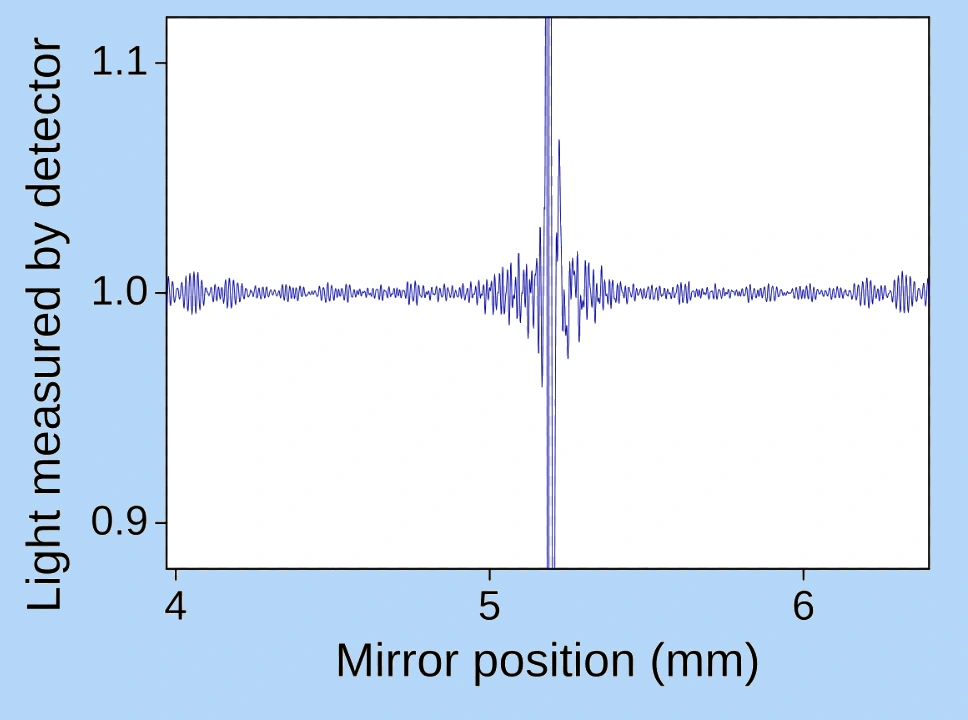
Contained in this interferogram is all the information on how the sample has absorbed infrared light of different wavelengths. In principle this data could, if required, be plotted out by software. However, this particular form looks totally different from our familiar presentation of a spectrum that we are normally used to seeing from diffraction grating (dispersive) spectrometers. The interferogram shows how strongly the sample absorbs IR light as a function of the position of the movable mirror. That’s all.
Nevertheless, all the sample absorption information is there, contained (hidden, one might say) in the interferogram. We just need a means of extracting this absorption information, for each and every IR wavelength as the movable mirror in the interferometer steps through its range, and then to present this data in the more familiar form of an absorption spectrum.
The Fourier Transform
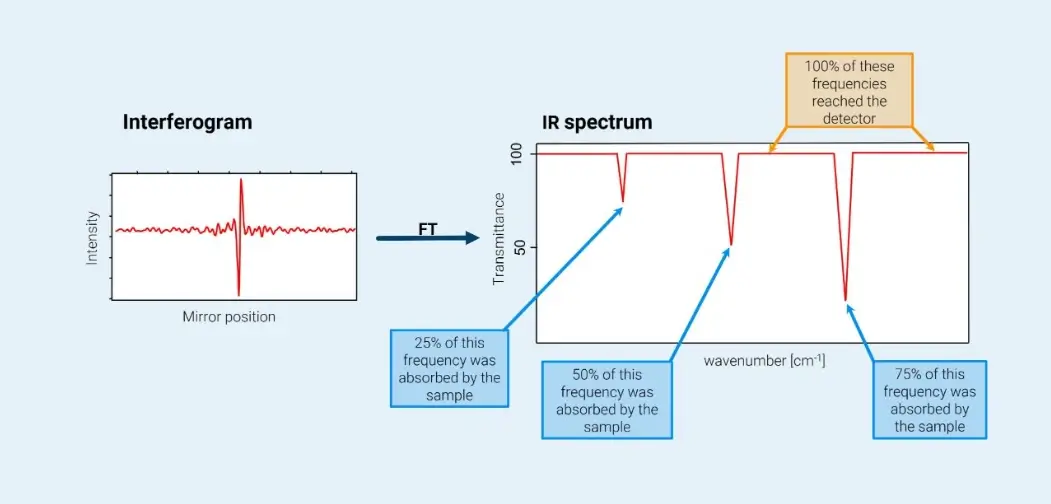
Fortunately, there exists a mathematical function, named in honour of the 18th century French physicist and mathematician Joseph Fourier, called the Fourier transform. Without going into the mathematical details, the Fourier transform essentially extracts the frequencies of the original waves from the data representing the different interference patterns at different mirror positions in the interferogram. This transformation is done extremely fast with today’s modern computer software and the resulting, and familiar, IR spectrum can be obtained within seconds.
As a very simple example, consider two waves of, say, 3 cm-1 and 5 cm-1, interacting in the interferometer. The wave interaction looks something like this schematic diagram (courtesy of Bruker Corp. and used with permission).
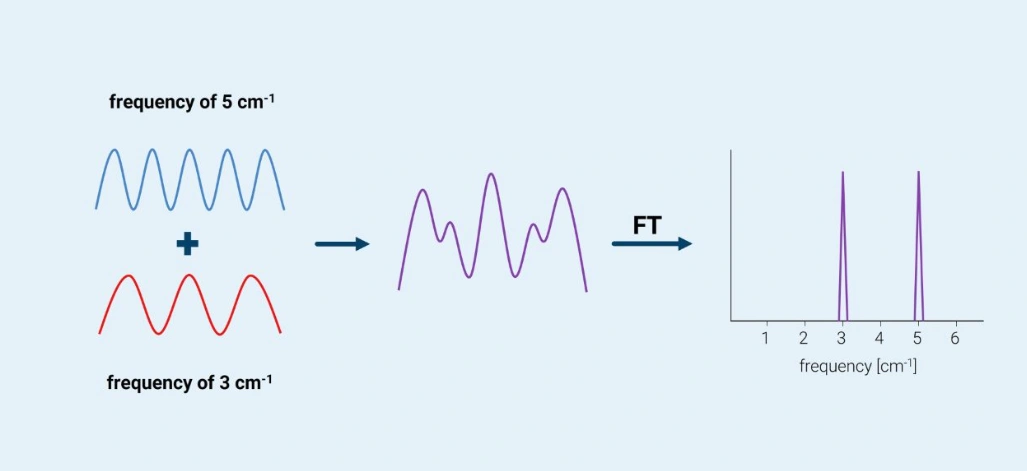
Once the two waves have interacted, the waveform resembles the middle wave in the above diagram. After applying the Fourier transform, the result is two signals displaying the original frequencies. In this simplistic 2-wave example, it is relatively easy to identify the original wave frequencies from the interferogram. But as more and more waves interact with each other, the result becomes extremely complicated. Fortunately, after the Fourier transform operation has been applied, the original frequencies are readily extracted and identified by fast software.
The Reference Spectrum
There is one final step needed before we can obtain a high quality infrared spectrum of a sample. With infrared spectroscopy, there are two molecules that absorb strongly at different wavelengths across the IR region, namely water vapour and carbon dioxide. They are of course always present in the air we breathe and will show up in the spectrum if precautions are not taken.
The different H2O and CO2 absorption bands, with descriptions of the molecular vibrations involved, are shown here in high resolution in figure xxx
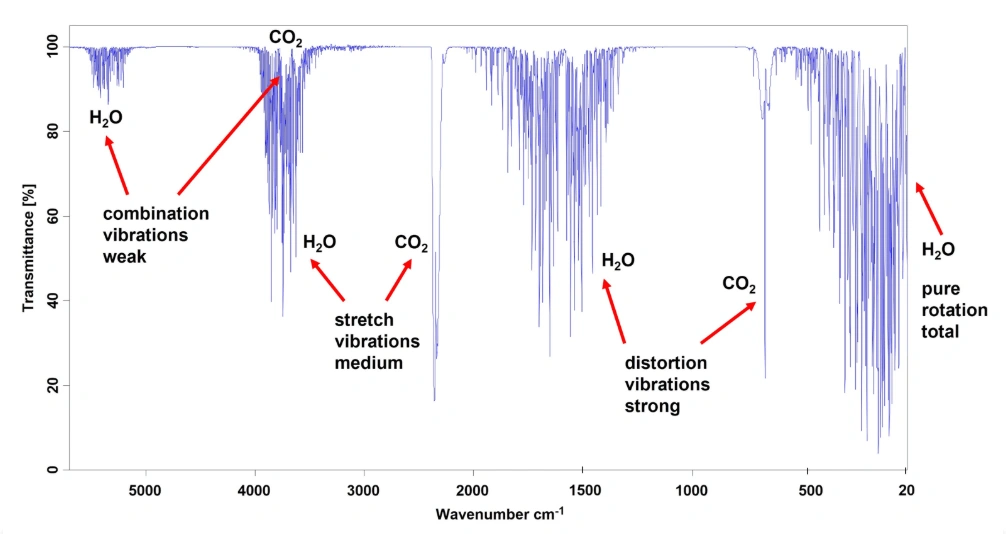
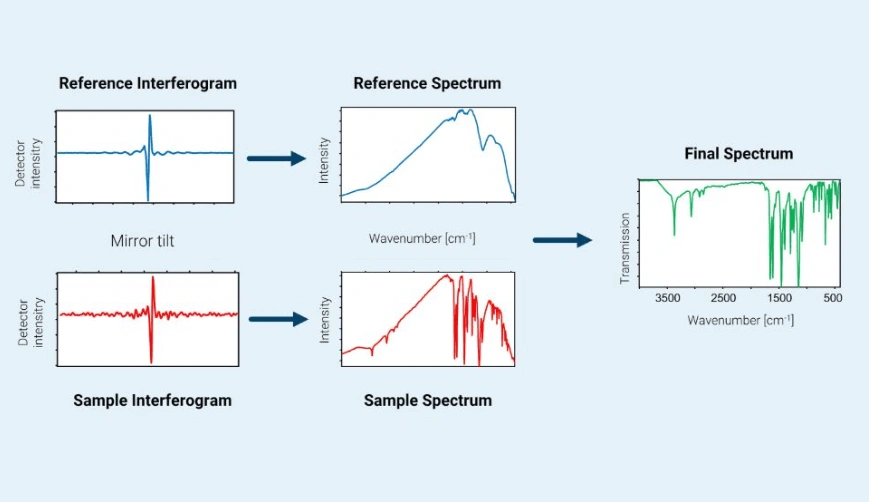
All these absorption bands could overlap and mask any IR vibrational bands from the sample of interest. To avoid this, a reference interferogram is first taken without the sample being present. A Fourier transform is then applied to this reference interferogram to produce a reference spectrum of H2O and CO2 absorption bands. Once the reference spectrum has been calculated, it is mathematically removed from the sample spectrum as shown here (again courtesy of Bruker Corp. and used with permission).
The resulting IR spectrum of the sample is of good spectroscopic quality with a high signal-to-noise ratio (S/N). The spectrum is obtained very quickly, literally within a few seconds for a single software spectral scan, although in practice multiple scans are usually performed, and are recommended, in order to improve S/N even more.
Light Source and Detector
Finally let’s not forget the two other important components in any infrared spectrometer, whether it’s a dispersive instrument or an FTIR instrument. These are the light source and the detector.
- IR Source
The light source is perhaps the simplest component of any IR spectrometer. After all, all we need is some form of heated element that will emit IR. Common sources for the mid-IR region are inert ceramic solids, often a silicon carbide rod also known as a Globar, that is heated electrically to about 1,200 K. This generates a stable, broadband thermal emission profile, similar to a Black Body emitter, across the mid-IR region. Tungsten-halogen filament lamps are also found, although these are primarily used in near-infrared (NIR) spectrometers, because the lamp output drops significantly at wavelengths longer than 2000 cm-1. This would prevent the lower frequency vibrations of many organic molecules from being analyzed.
- IR Detectors
For detectors, there have been several changes over the years for both dispersive and FT spectrometers. They can be classified into three categories: thermal detectors, pyroelectric detectors and photoconducting detectors.
Thermal detectors can be used over a wide range of wavelengths, and they operate at room temperature. Their big disadvantage, especially for FT spectrometers which makes them unusable, is a slow response time and lower sensitivity relative to other types of detectors.
The most common type of pyroelectric detector for an FT spectrometer is based on the crystalline material triglycine sulphate (TGS). To improve their properties for IR equipment, TGS crystals are first deuterated with protons in the crystal structure being replaced with deuterium ions. In addition, the amino acid L-Alanine is used during manufacture to dope the deuterated TGS. This produces a final material called Deuterated L-Alanine Doped Triglycine Sulphate or DLATGS.
Unlike other thermal detectors the pyroelectric effect depends on the rate of change of the detector temperature rather than on the temperature itself. This allows the pyroelectric detector to operate with a much faster response time and makes these detectors a good choice for fast Fourier transform spectrometers where a rapid response is essential.
Photoconducting detectors are the most sensitive detectors. They rely on interactions between photons and a semiconductor. A common type is the mercury cadmium telluride (MCT) detector, with the sensitive surface deposited on a nonconducting glass and sealed into an evacuated envelope to protect the semiconductor from the atmosphere. The MCT detector is the most sensitive of detectors for the mid-IR region. It’s one big inconvenience, however, is that it must be cooled to liquid nitrogen temperature (77 K) to function optimally.
On a personal note, as a lab manager in the 1990’s, we invested in a new FTIR spectrometer for the company’s different R&D projects. This was a Nicolet Nexus 870 FTIR spectrometer with a fairly high specification. It had a sensitive MCT detector, and our team had to take turns, even coming into work over the weekends, to ensure that the dewar containing the detector and liquid nitrogen, was topped up fully. If you didn’t, and the detector went up to room temperature, several days were lost re-equilibrating the sensor back at 77 K again ☹!
Conclusions
There is little doubt that the introduction of FTIR spectrometers in the late 1970’s and early 1980’s initiated a veritable revolution in infrared spectroscopic methods. It can be said that FT instruments have become the reference standard for the characterization of organic molecules that absorb light in the mid-infrared, having completely replaced their dispersive counterparts.
In the final (part 3) of this article, I shall mention several accessories that are used with a modern FTIR spectrometer in order to handle different samples.
Coming soon!
Steve