Introduction
As its name implies, this spectrometer has a fixed diffraction grating. So the wavelength range available and the resolving power (the spectral resolution) are pre-determined during manufacture. Oriel (now Newport Corporation) used to offer 4 models with different wavelength ranges and resolutions for this spectrometer, but I am not sure if these are still available since they do not appear on the Oriel Newport site. So try second hand sites if you are interested in this device.
FICS spectrographs have unique aberration corrected ion-etched holographic concave gratings . These are specifically designed for multichannel array detectors (so-called “linear” CCDs and CMOS chips) to produce precise imaging at a flat focal plane.
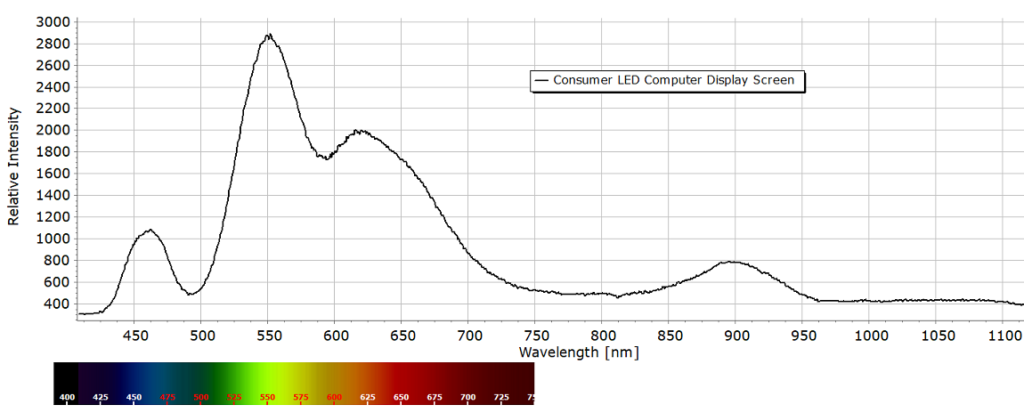
The FICS spectrograph shown here is well matched to the InstaSpec IV CCD sensor that I use with the MS125. The nominal spectral range of this spectrograph is from 400-1100nm. So as well as the visible region, the instrument is capable of recording well into the near-IR with the right detector. Since most front-illuminated CCD sensors are still quite sensitive well beyond red wavelengths this is not a problem. The rather modest Hamamatsu 1024×64 sensor in the InstaSpec IV detector here still possesses a quantum efficiency QE of about 8% at 1000nm.
The throughput of a spectrometer, which is also known as the étendue (from the French for “extent”) is a measure of its overall efficiency. Without all the fancy mathematics, this can be defined as how many photons per second per steradian pass through the entrance slit of any spectrometer and reach the detector with minimal losses. The throughput of the FICS is relatively high owing to its low 2.1 focal ratio. So this a very “fast” spectrograph in terms of efficiency; it is capable of recording very low light intensities with the right detector.
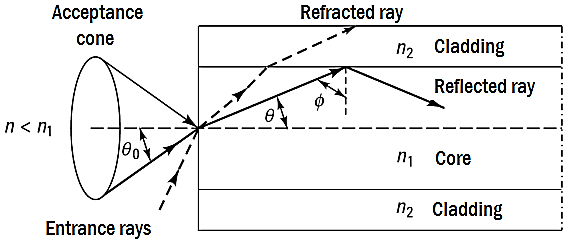
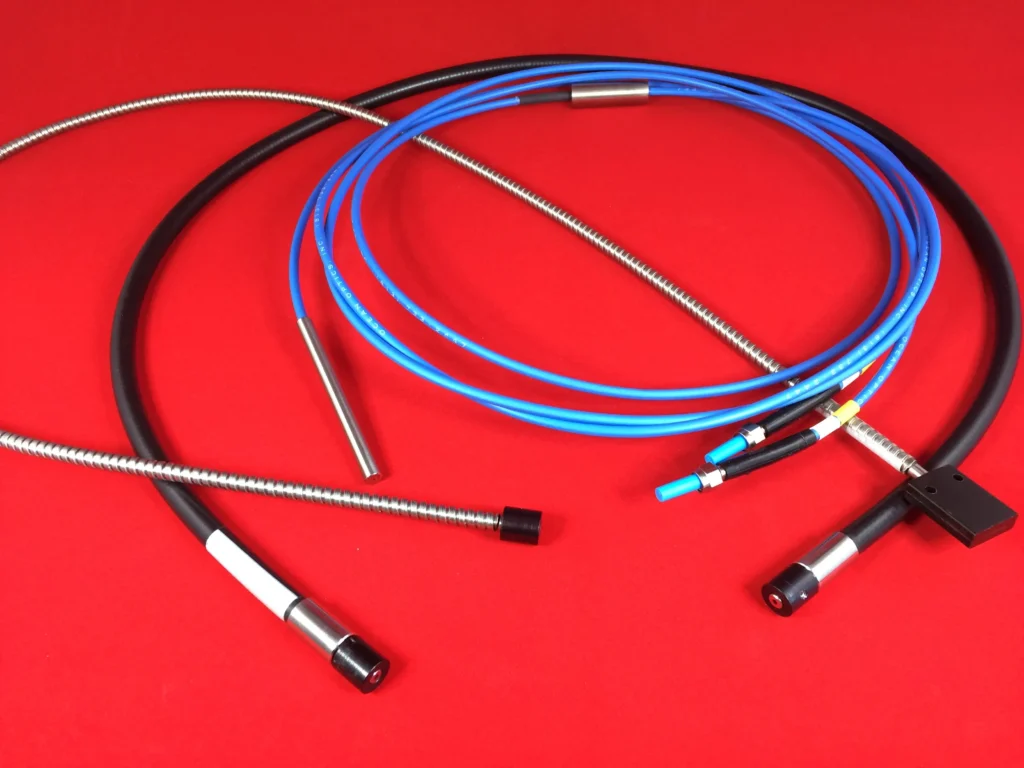
This does, however, come at the expense of a lower spectral resolving power, when compared to the MS125 spectrometer, for example. Its low focal ratio mentioned above is deliberately designed to be as close a match as possible to the emergent light cone from fused silica optical fibres which is around f/2.2. So no f/number matching (that would otherwise require additional optical components) is necessary. The fibre core itself can act as the input slit. Using fibres with this spectrograph is the best method to record spectra.
An additional advantage of the FICS is that it has the absolute minimum number of optical components in order to design a spectrometer. With all optical instruments, whether they are spectrometers, telescopes, microscopes, whatever…, the more components you add, the greater the number of optical aberrations and reflection losses one tends to have. And the risk of stray light from parasitic reflections or refractions from these extra elements can become significant.
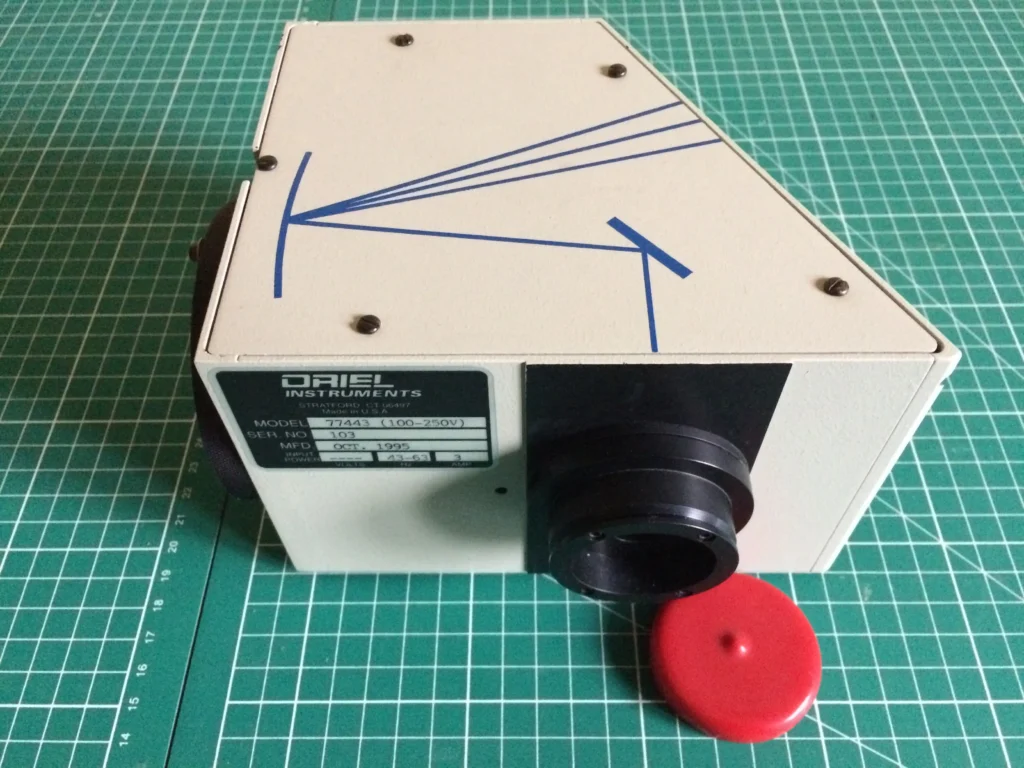
Re-entrant spectra can be a common problem with spectrometers and are a product of stray light. They are caused when light rays are reflected from the surface of the detector back into the body of the spectrometer and are diffracted by the grating a second time. This often happens if stray light is not controlled. Apart from a small plane mirror (see the picture below), the concave grating is the only other optical element in the FICS. Moreover, the image focal plane is tilted in such a way as to avoid re-entrant spectra. The result is that the FICS exhibits extremely low stray light values.
Some Examples
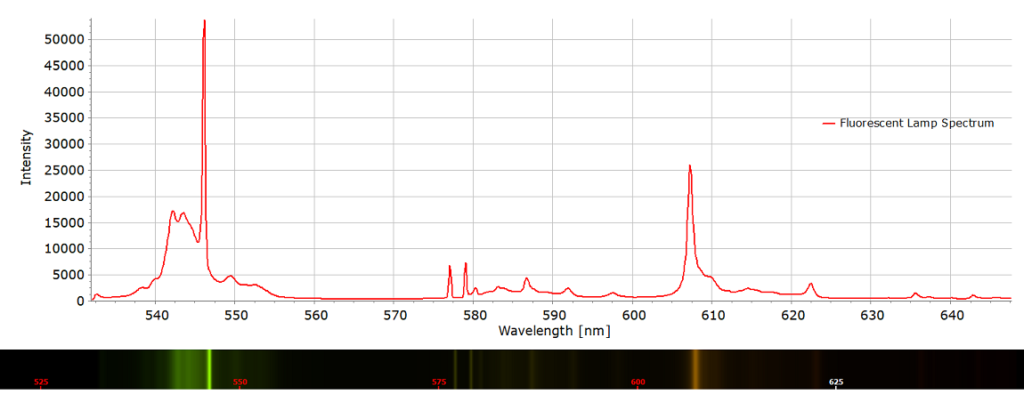
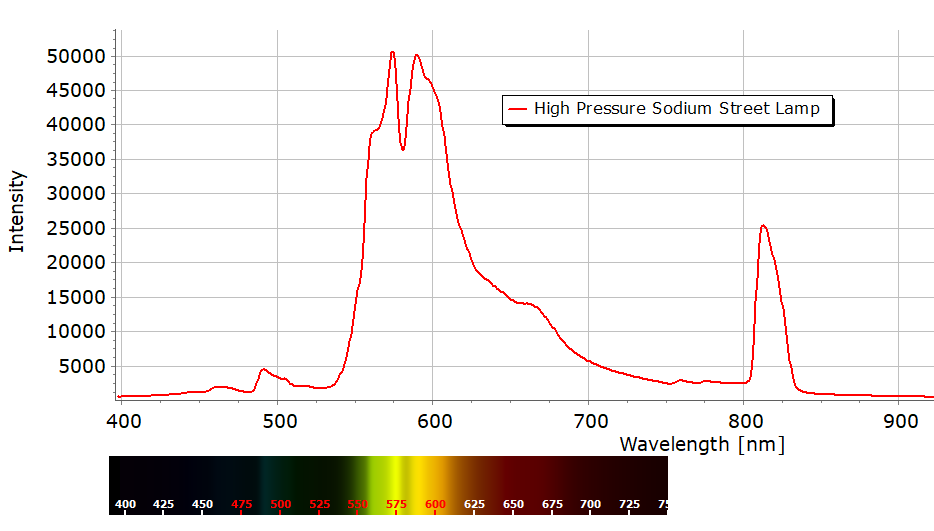
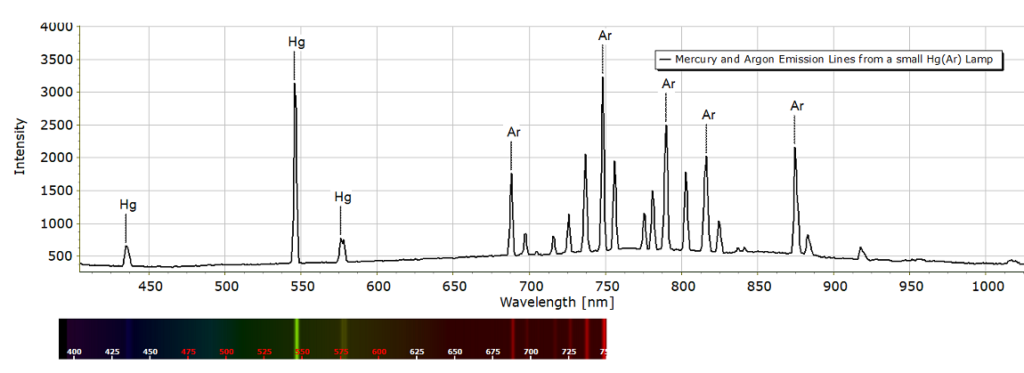
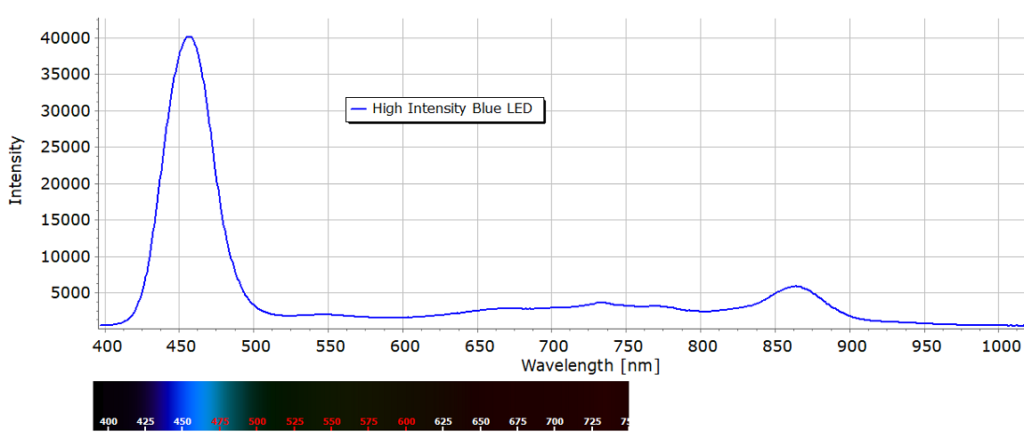
Several example spectra that can be obtained with the FICS are provided below, obtained from a fluorescent lamp from my kitchen, and shows the discrete emission lines due to mercury at 546 nm and the weak Hg doublet at 576 and 579 nm. The stronger line in the red at about 608 nm is probably due to Ne.
