Reflection is simply the return of a light ray from any surface without any change in wavelength. It is also referred to as Reflectance, defined as the effectiveness of any material in reflecting (returning) radiant energy of any wavelength, not just visible light. It comes in two types: (1) Specular Reflection, in which the angle of incidence is equal to the angle of reflection, and (2) Diffuse Reflection, where the angle of incidence is not equal to the angle of reflection.
All surfaces return a mix of both specular and diffuse reflections. Generally speaking, the glossier the surface the more specular is the reflection, and the more matt the surface the more diffuse is the reflection. Reflection is usually expressed as a percentage (%Rλ) relative to the reflection of light from some standard reference substance (often a pure white standard) and can be expressed as:
%Rλ = (Sλ – Dλ) / (Rλ – Dλ) x 100%
where S is the reflected light intensity of the sample under study, D is a background or “dark” intensity measurement and R is the intensity of light from a reference standard, all measured at some given wavelength λ.
Of course when we record the reflectance spectrum from some surface, it is not just one wavelength that we are dealing with but a whole gamut of wavelengths across the visible spectrum, or other regions that we are interested in. And this is where we get into the concept of colour.
The concept of colour can be a complex and subtle subject and is also highly subjective. For example, one person’s light blue could well be another person’s light blue-green or something else entirely. And think about all those shades and subtle hues available in DIY stores the next time you go shopping for a tin of paint. These days they all tend to have fancy marketing names that don’t really mean very much from a quantitative perspective!
So an agreed system of basic colour standards is extremely important and the use of different standards has been implemented over time depending on the application and the industry requiring it.
A useful practical standard for imaging applications is the ColorChecker Colour Rendition Chart from Macbeth Corporation. This simple chart has been used for many years in photography, the graphic arts and other imaging industries such as the manufacturers of cathode ray tube TV monitors and laptop displays and screens.
The MacBeth chart consists of a series of 24 scientifically prepared colour squares, or “swatches”, that encompass natural colours met in everyday life. Each Macbeth square is about 45 mm on a side, and printed on stiff card stock. The chart is slightly larger than a sheet of A4 size paper and many of the squares are representative colours of natural objects such as human skin, foliage and blue sky, factors important in achieving the correct colour rendition and balance in imaging and photography.
The squares reflect light in the same way in all parts of the visible spectrum and will match the colours of natural objects under any type of illumination, regardless of the colour reproduction process used.
Here is a typical image of the Macbeth card:
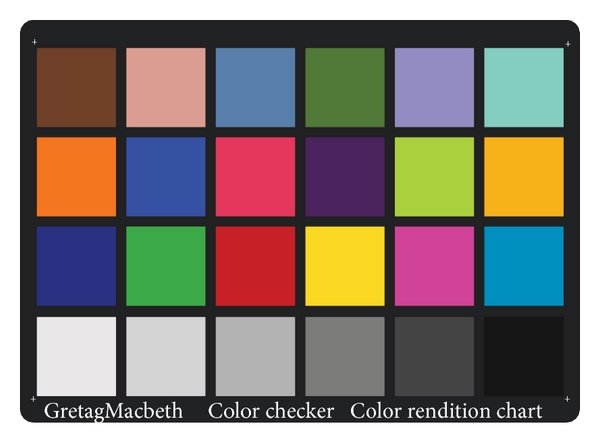
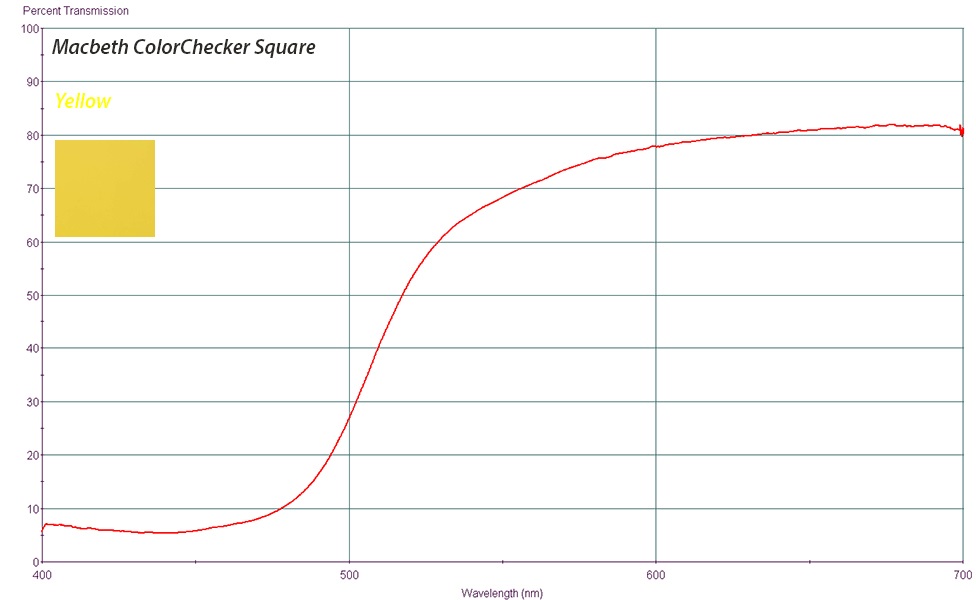
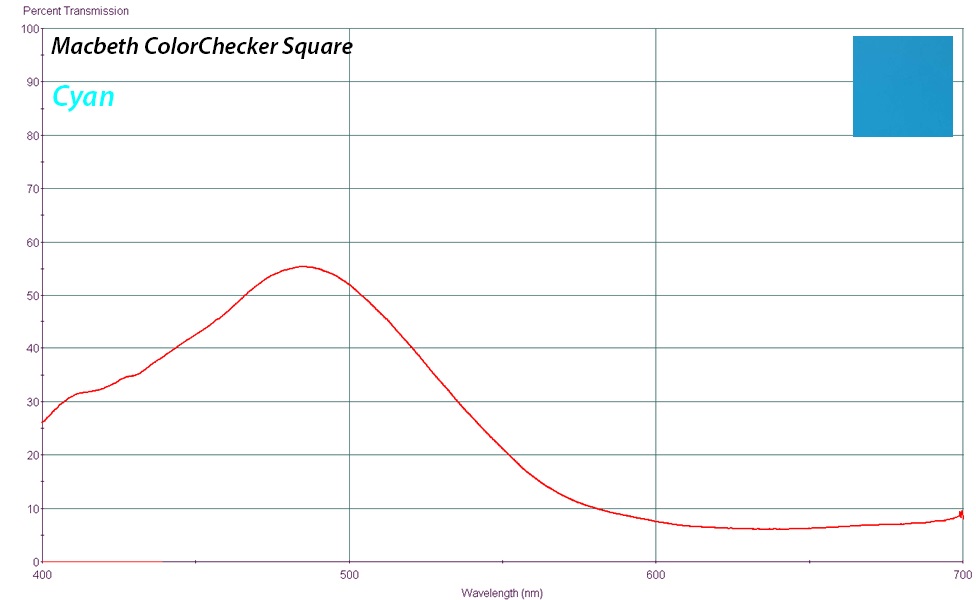
The top two rows of the ColorChecker card depict a series of common natural objects. The third row has the pure primary additive colours (blue, green, red) and their subtractive counterparts (yellow, magenta, cyan).
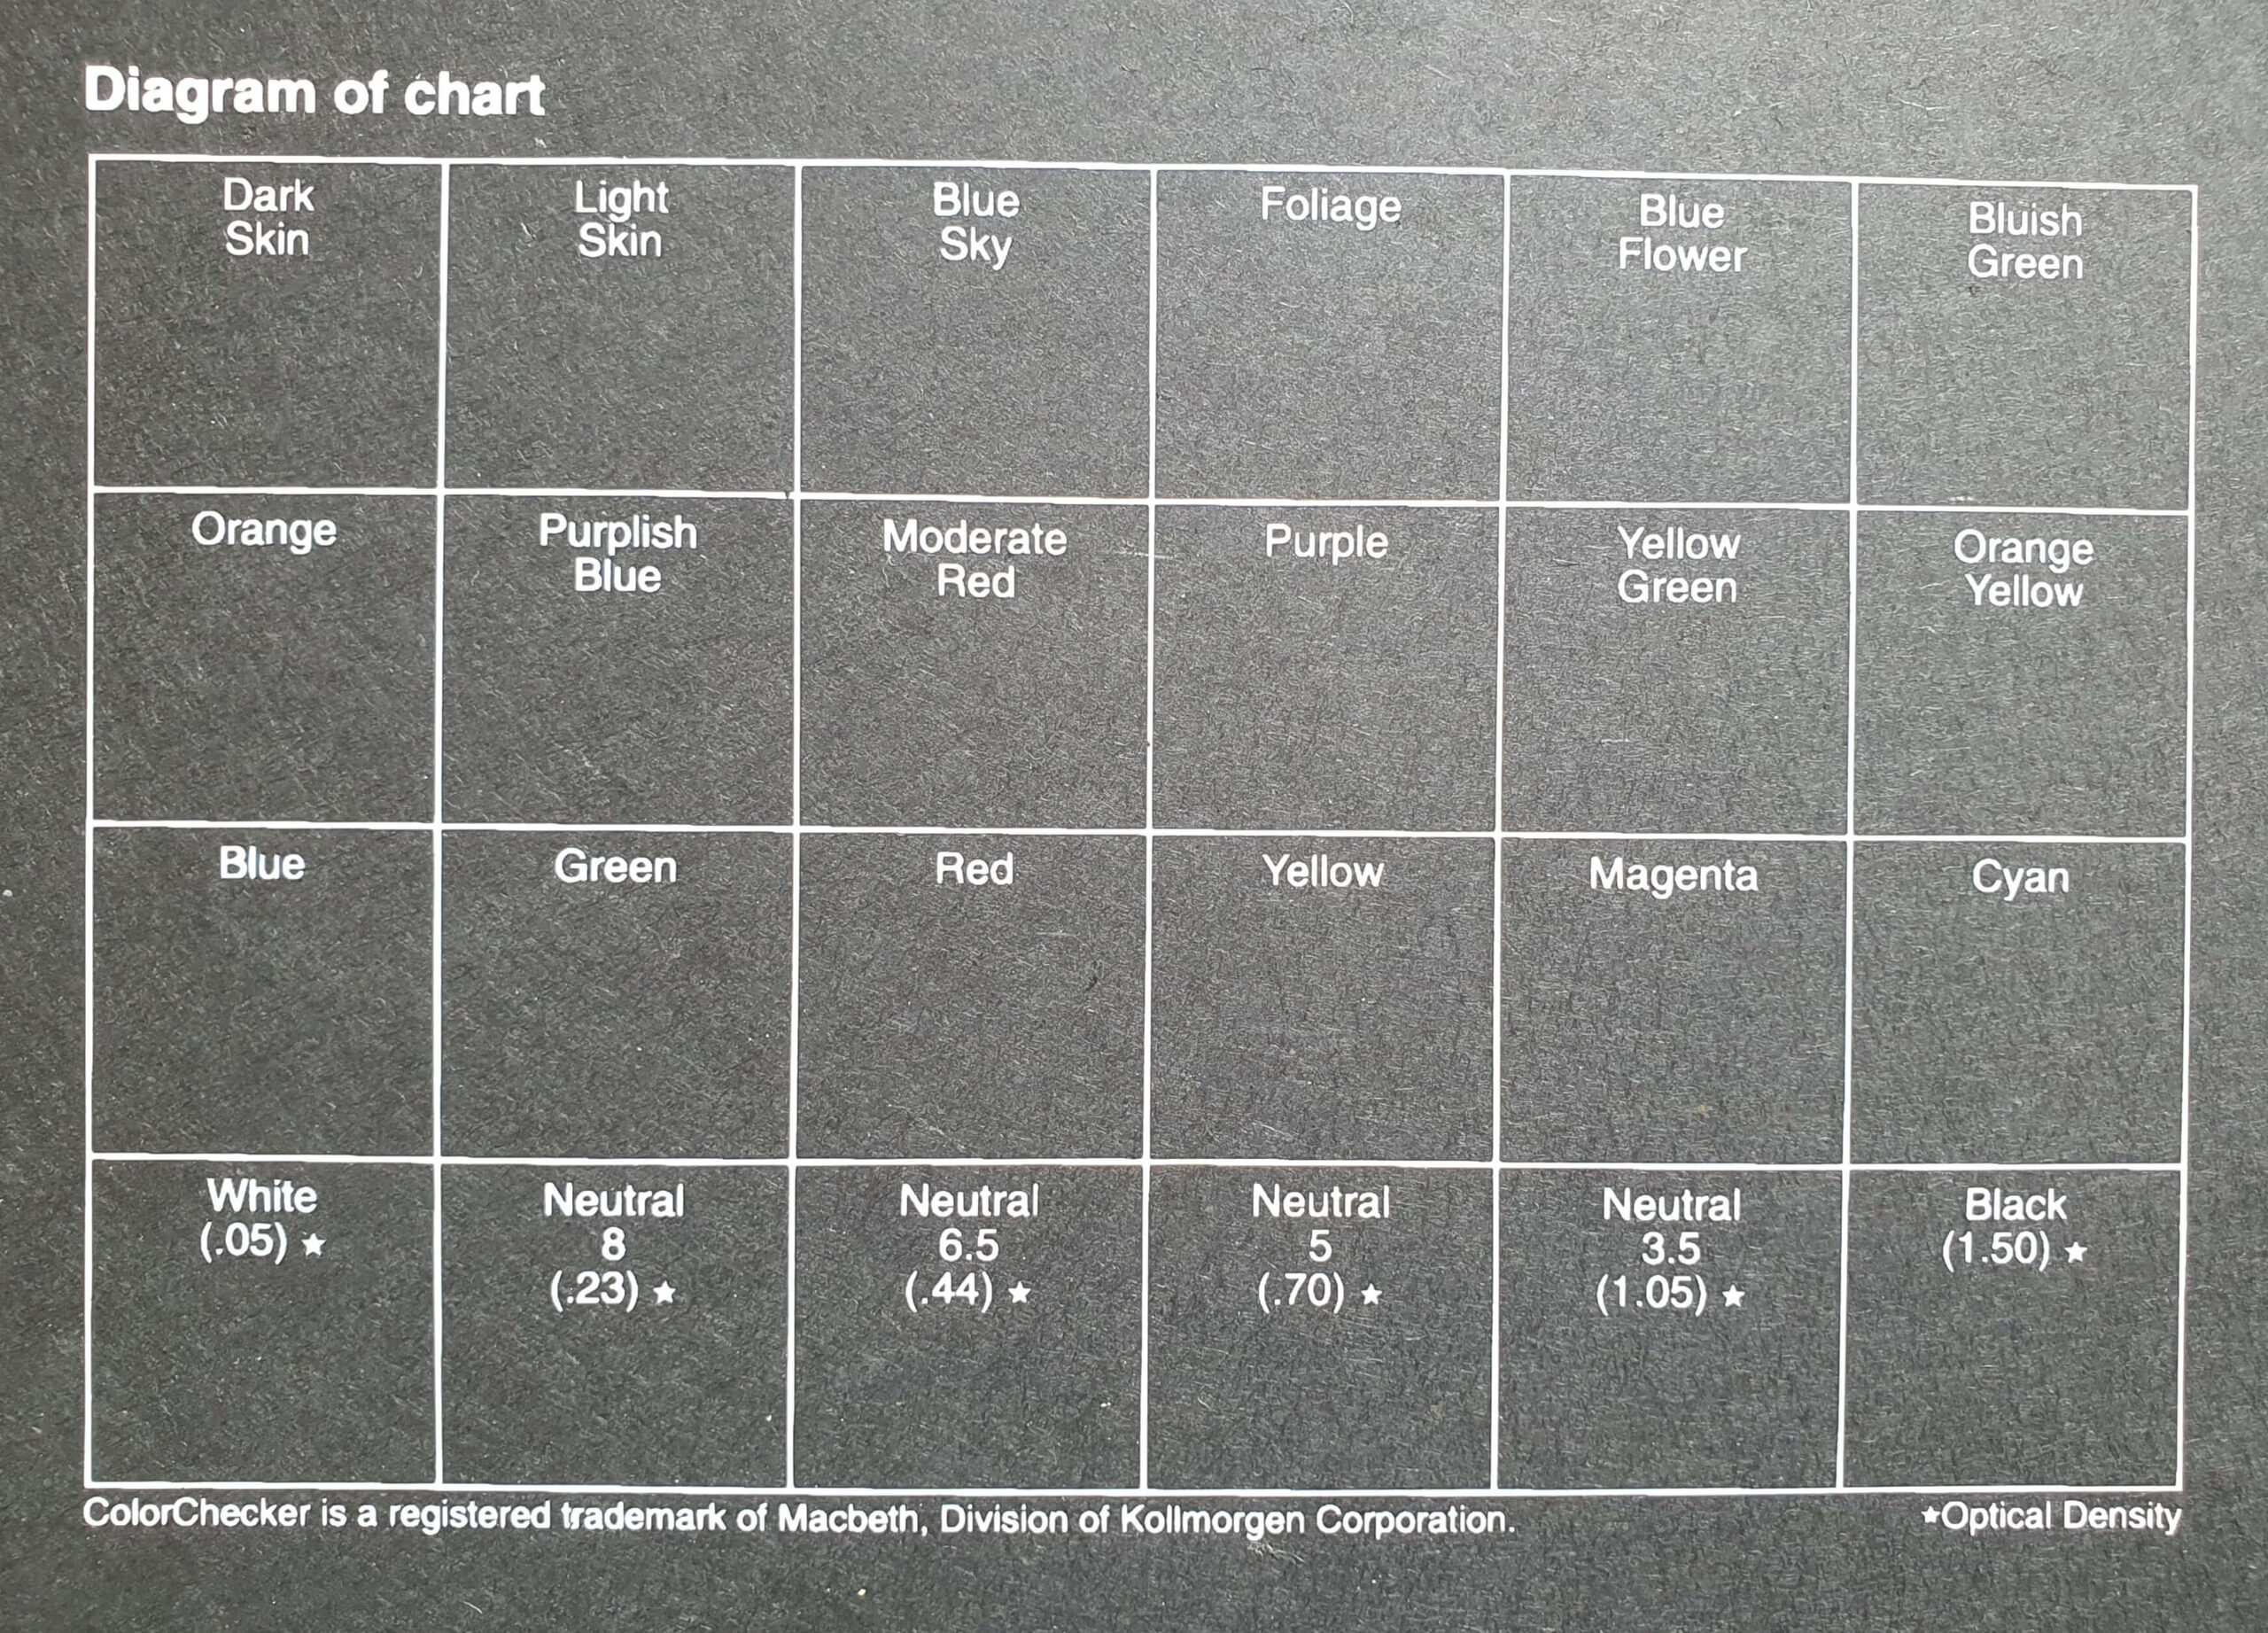
The last row on the card depicts grey scales from pure white through to pure black in units of optical density differences. The reverse side of the ColorChecker card is seen here where each of the squares is given an appropriate descriptive name:
Diffuse Reflectance Spectra
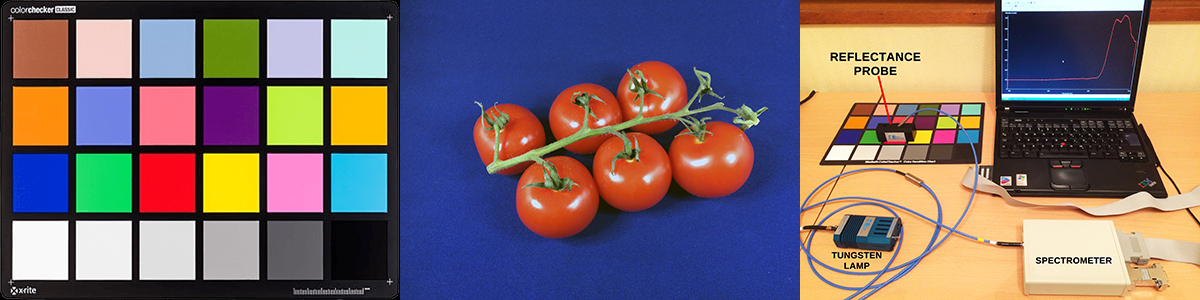
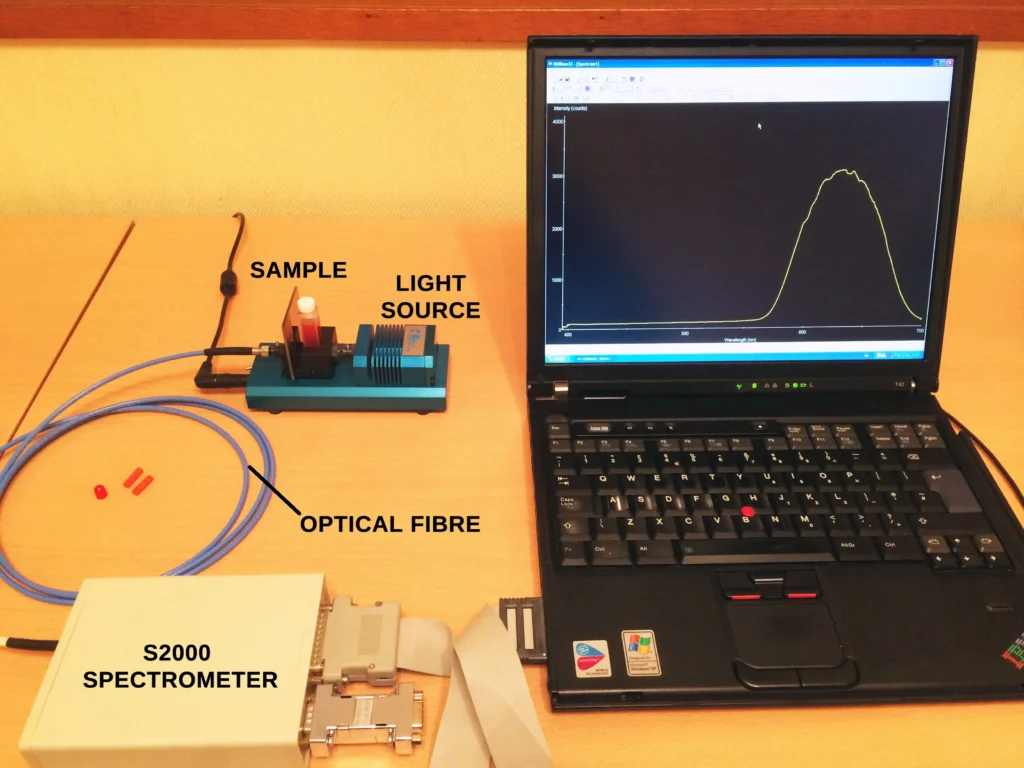
The objective is to measure the diffuse reflectance spectrum for each of the ColorChecker squares. The white light source used was an Ocean Optics tungsten filament lamp LS-1 and an optical fibre reflection probe (splitter type) was connected to an Ocean Optics S2000 spectrometer which recorded reflectance spectra from each square.
We are only interested in the colour squares. Therefore the pure white, black and grey scale squares were not recorded. In order to display the data as % Reflectance (or % Transmittance), measurements were made against a reference standard (see above equation).
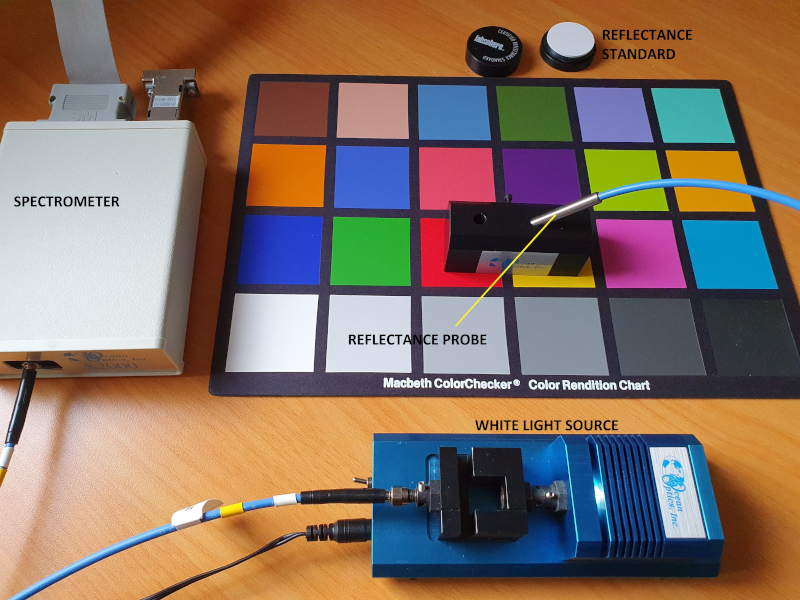
A pure white reference standard of a synthetic material called Spectralon®, available from Labsphere, was used as reference material, although any pure white material (e.g. zinc oxide, titanium dioxide powder, Teflon tape,) could also be used. The experimental setup is pictured below:
The Results
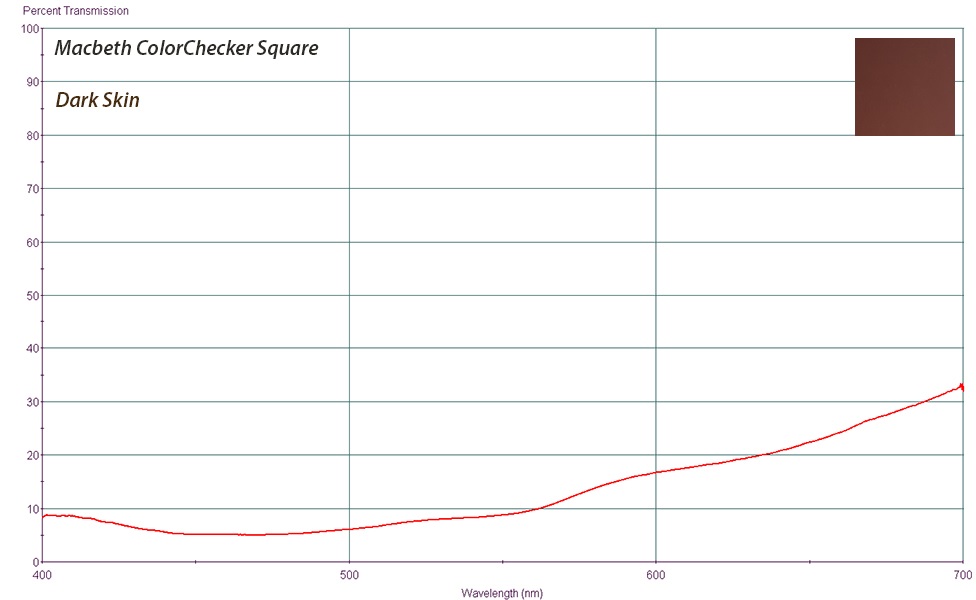
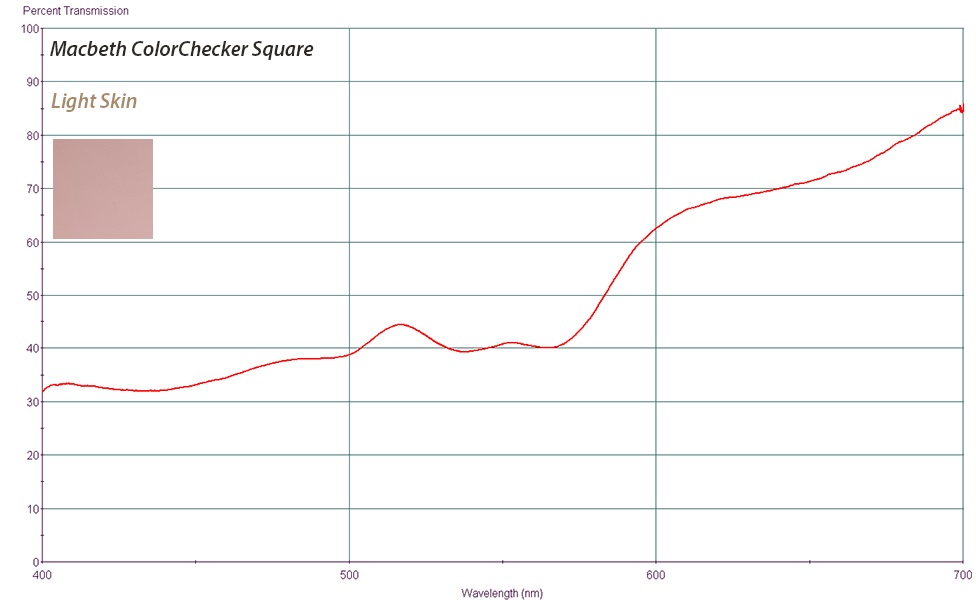
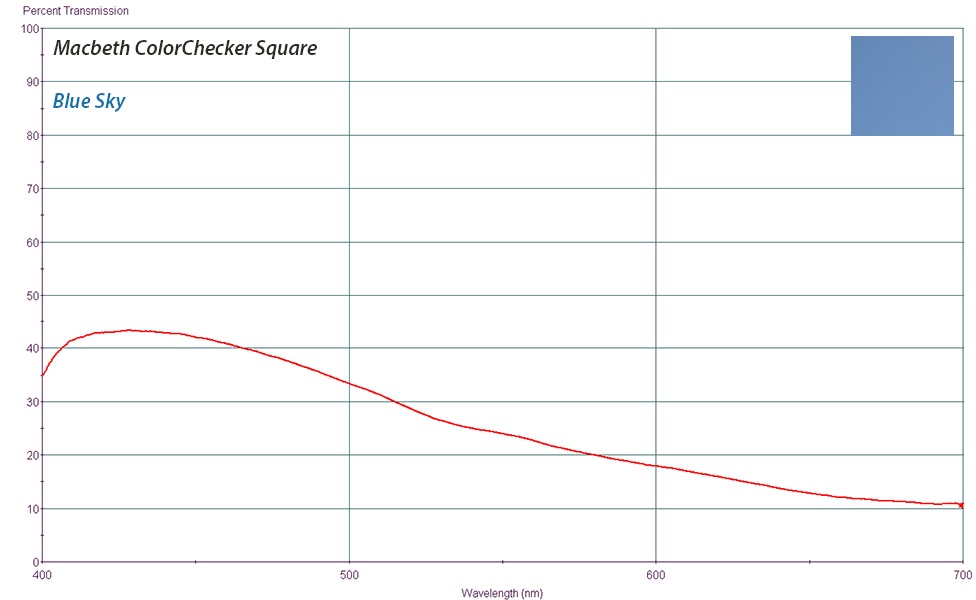
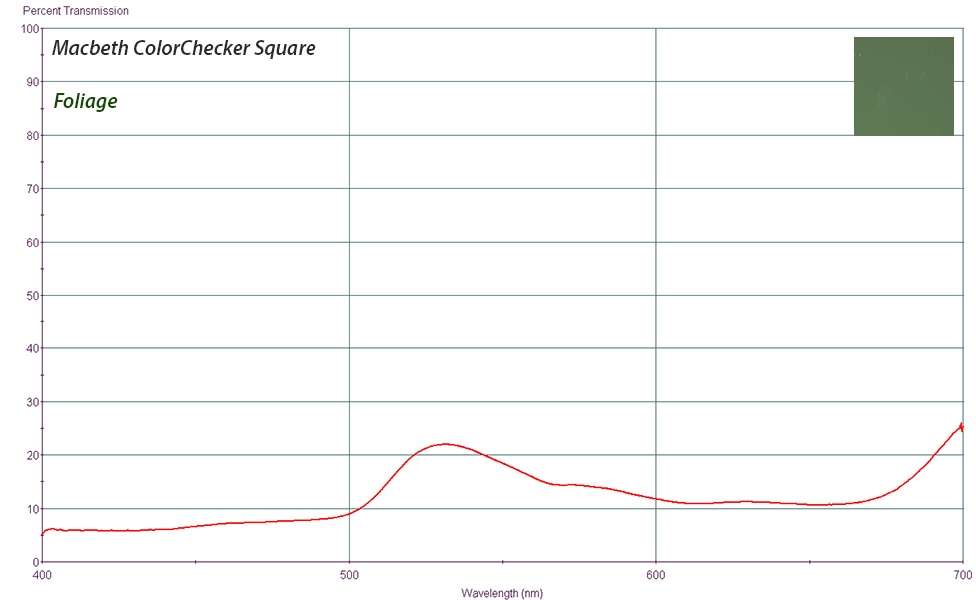
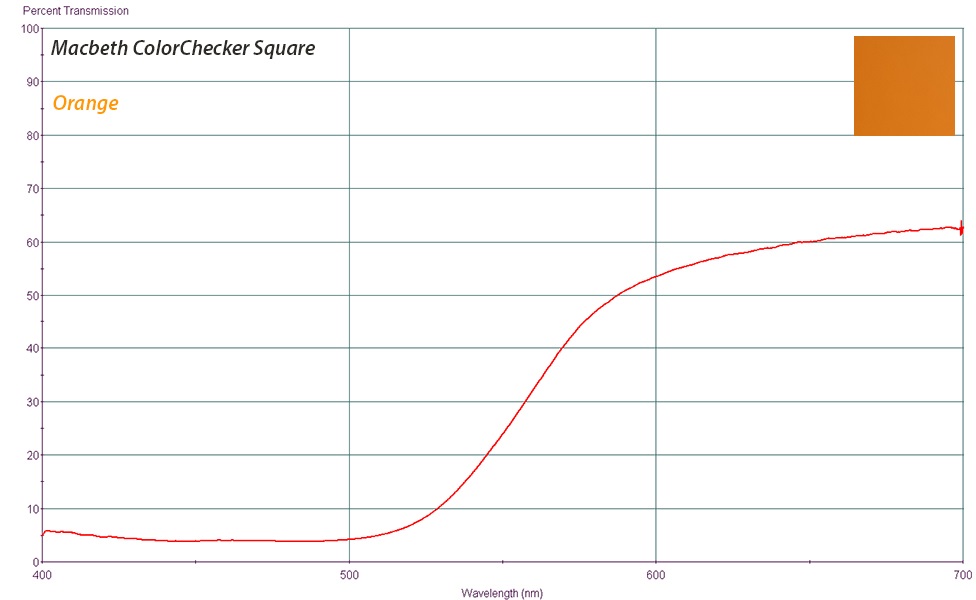
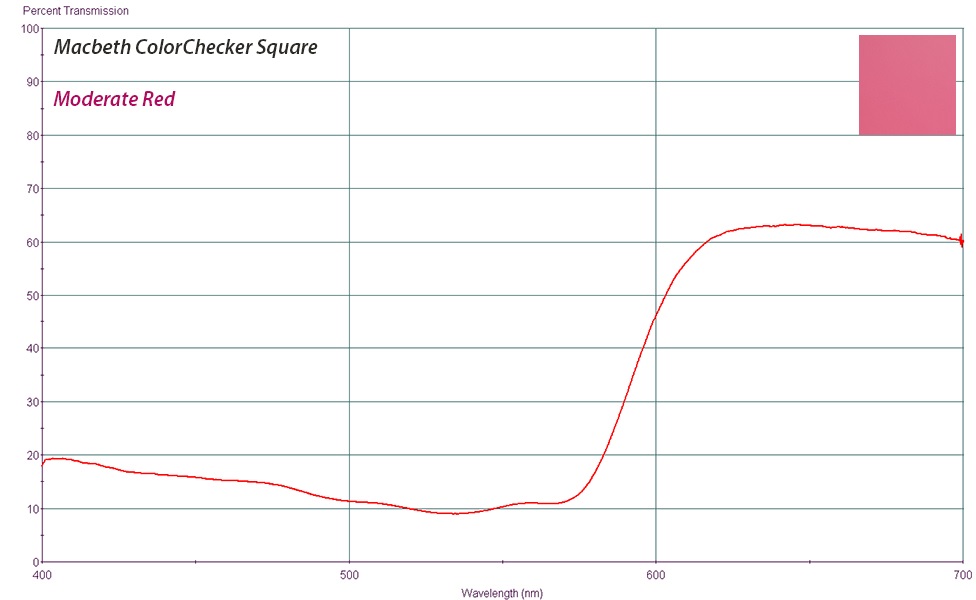
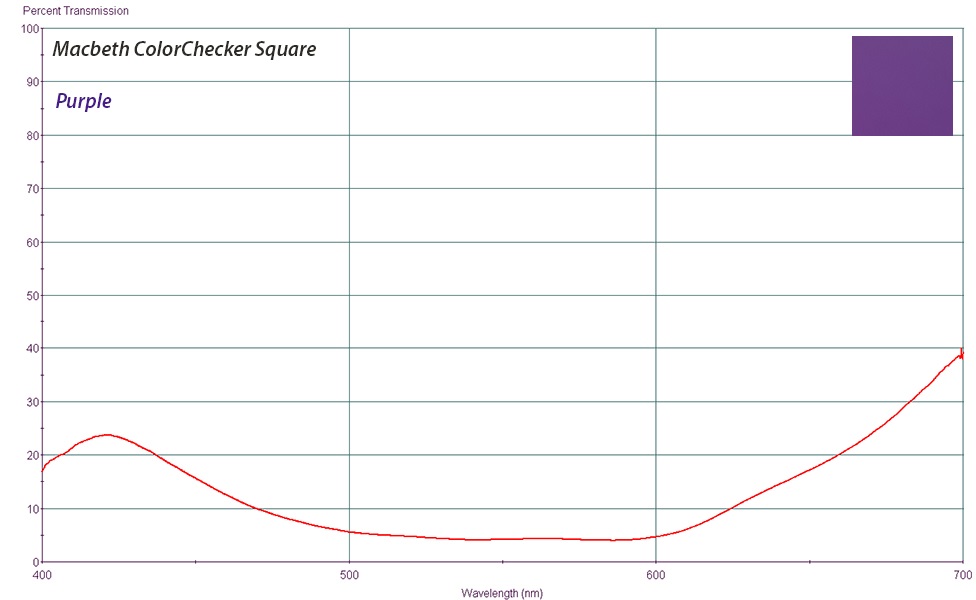
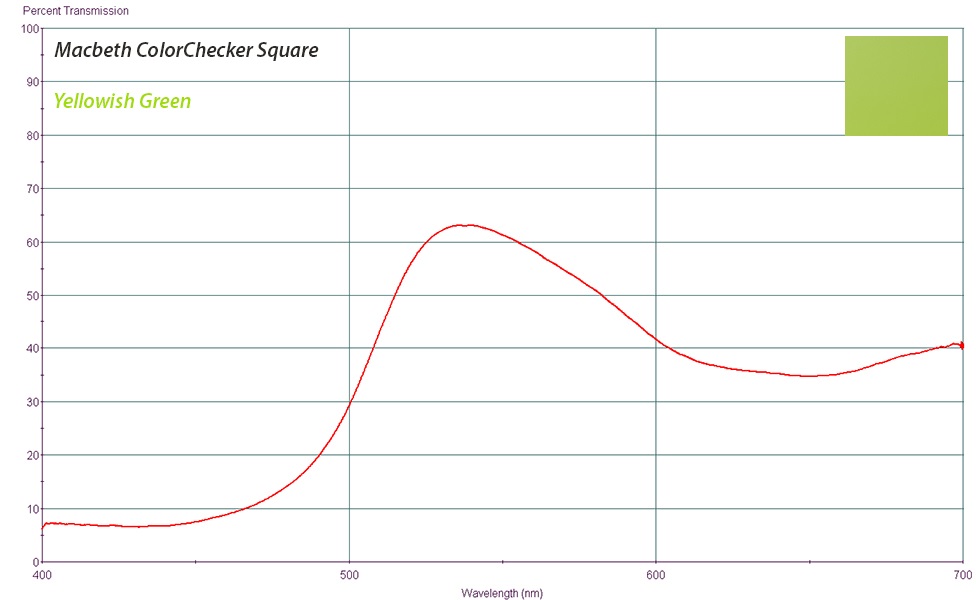
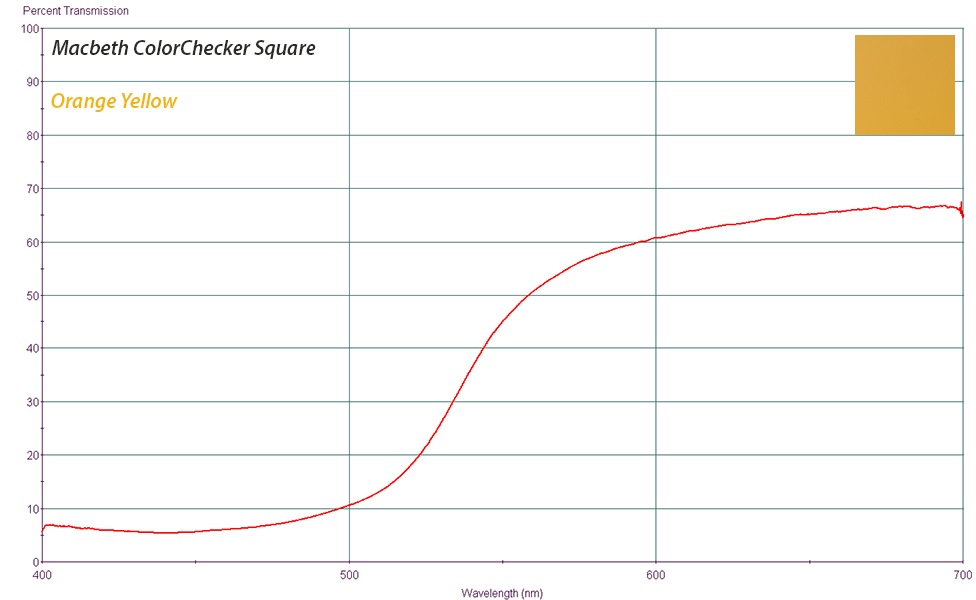
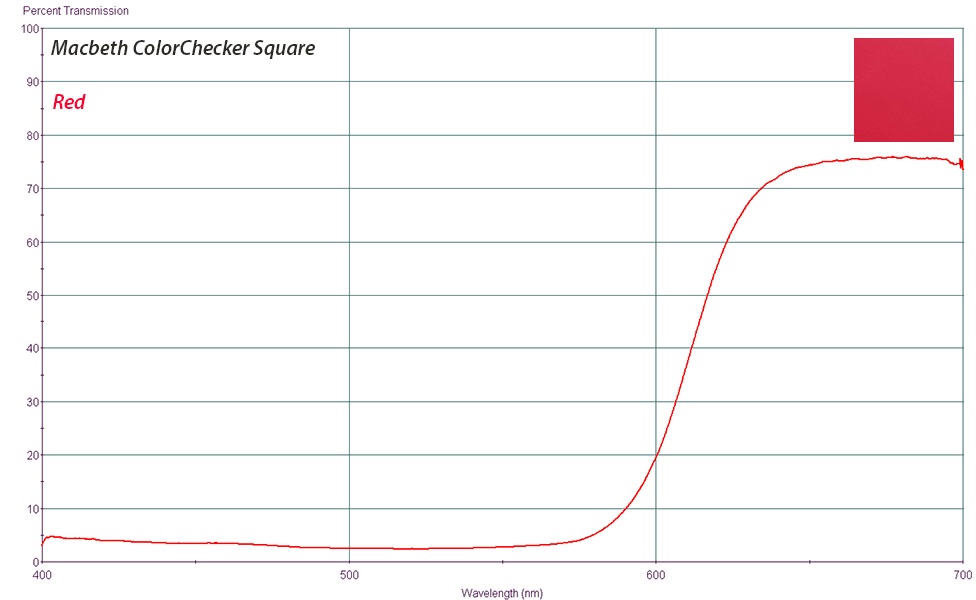
Browse through the gallery to see the reflectance spectra for each colour swatch…
Conclusions
Diffuse reflectance spectra from a wide range of materials and surfaces can be obtained with this technique. Future posts in this branch of spectroscopy will explore diffuse reflectance from coloured surfaces further.
Pingback: Thin Film Reflectometry (or How Thin is a Thin Film?) -