This post is to help the home experimenter identify the spectra of some common light sources that we all come across in the home. It gives us an indication of what to expect when we consider a light source for a particular application or whether we are simply curious about why some light sources have the colours and emission characteristics they have.
All spectra were recorded by using an optical fibre in front of the light source and transmitting the signal to a small spectrometer with a 25 or 50 μm slit width. All spectra were processed with Spectragryph spectroscopy software.
Light Emitting Diodes (LED's)
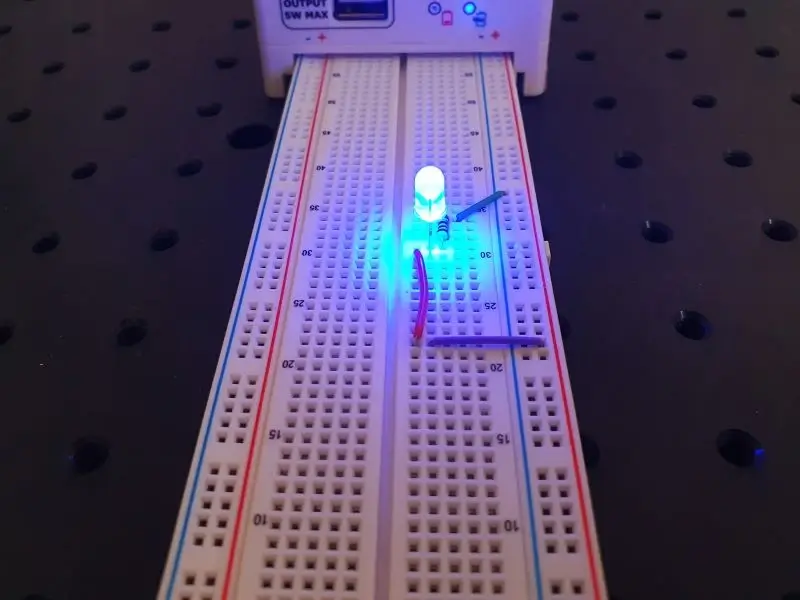
The light emitting diode or LED is ubiquitous these days. Whether it’s your annual Christmas tree lights, visual indicators on consumer electronics of all kinds, road safety signage, advertising billboards or any device needing some type of visual display, LEDs of all shapes and sizes can be found everywhere.
Today these light sources come in many different forms, shapes and sizes. However, they did have a humble beginning that started commercially with the fabrication of simple single diodes with two protruding wire electrodes in a coloured plastic casing. These very basic diodes are still in use today in various microelectronics projects.
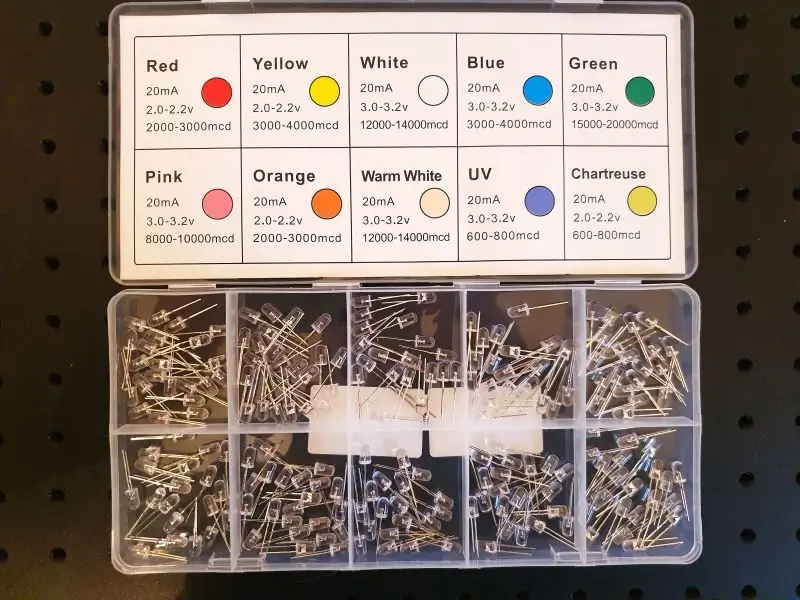
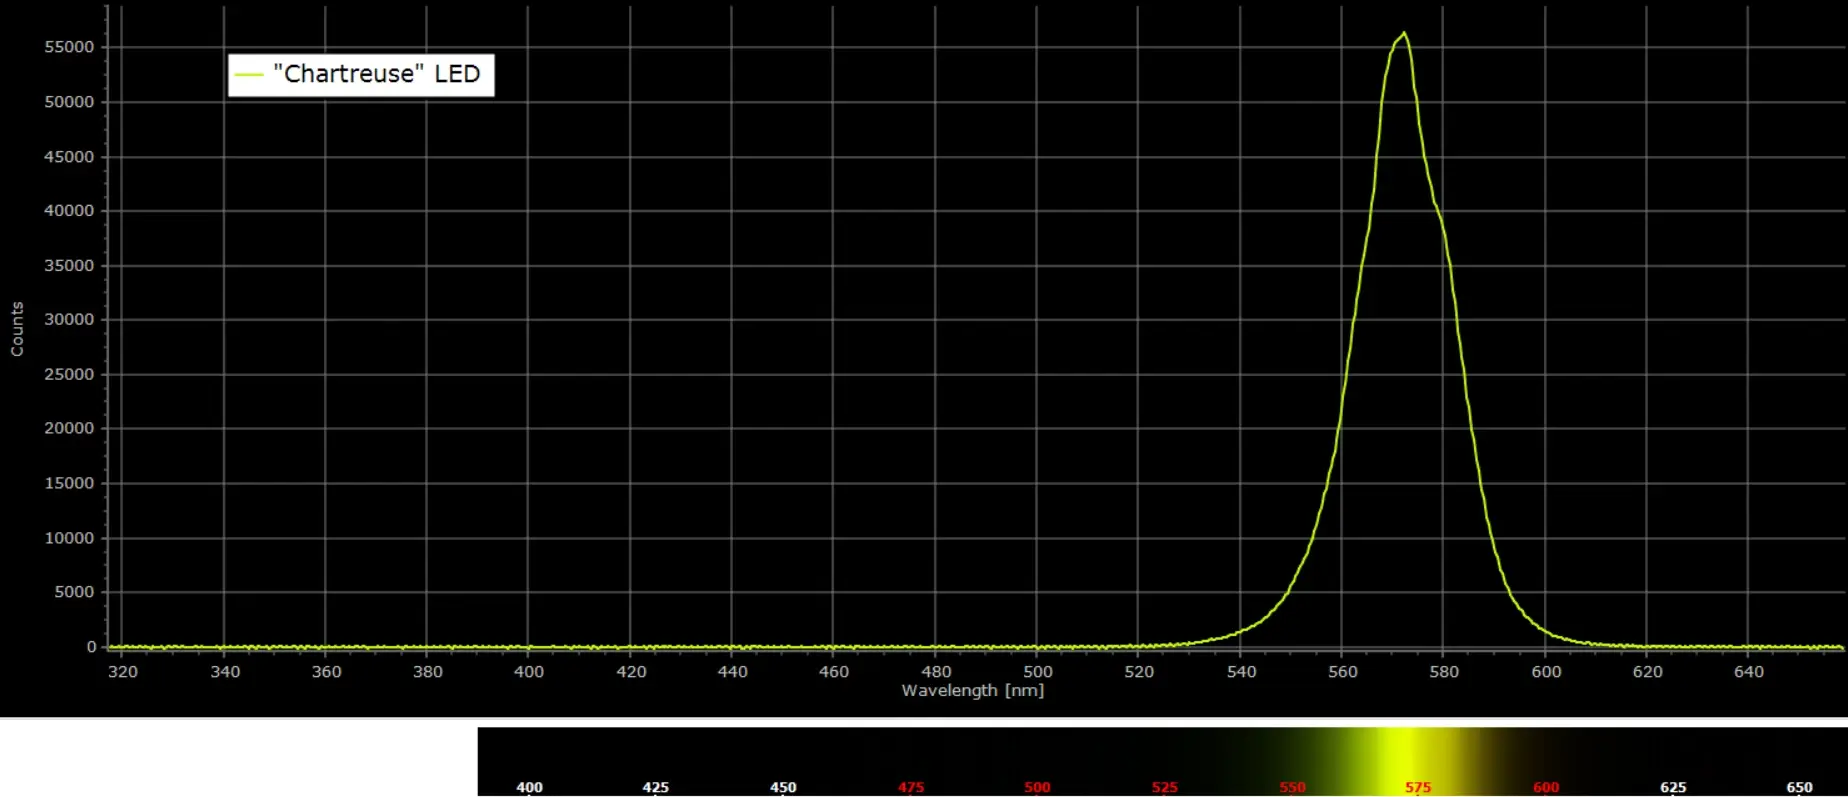
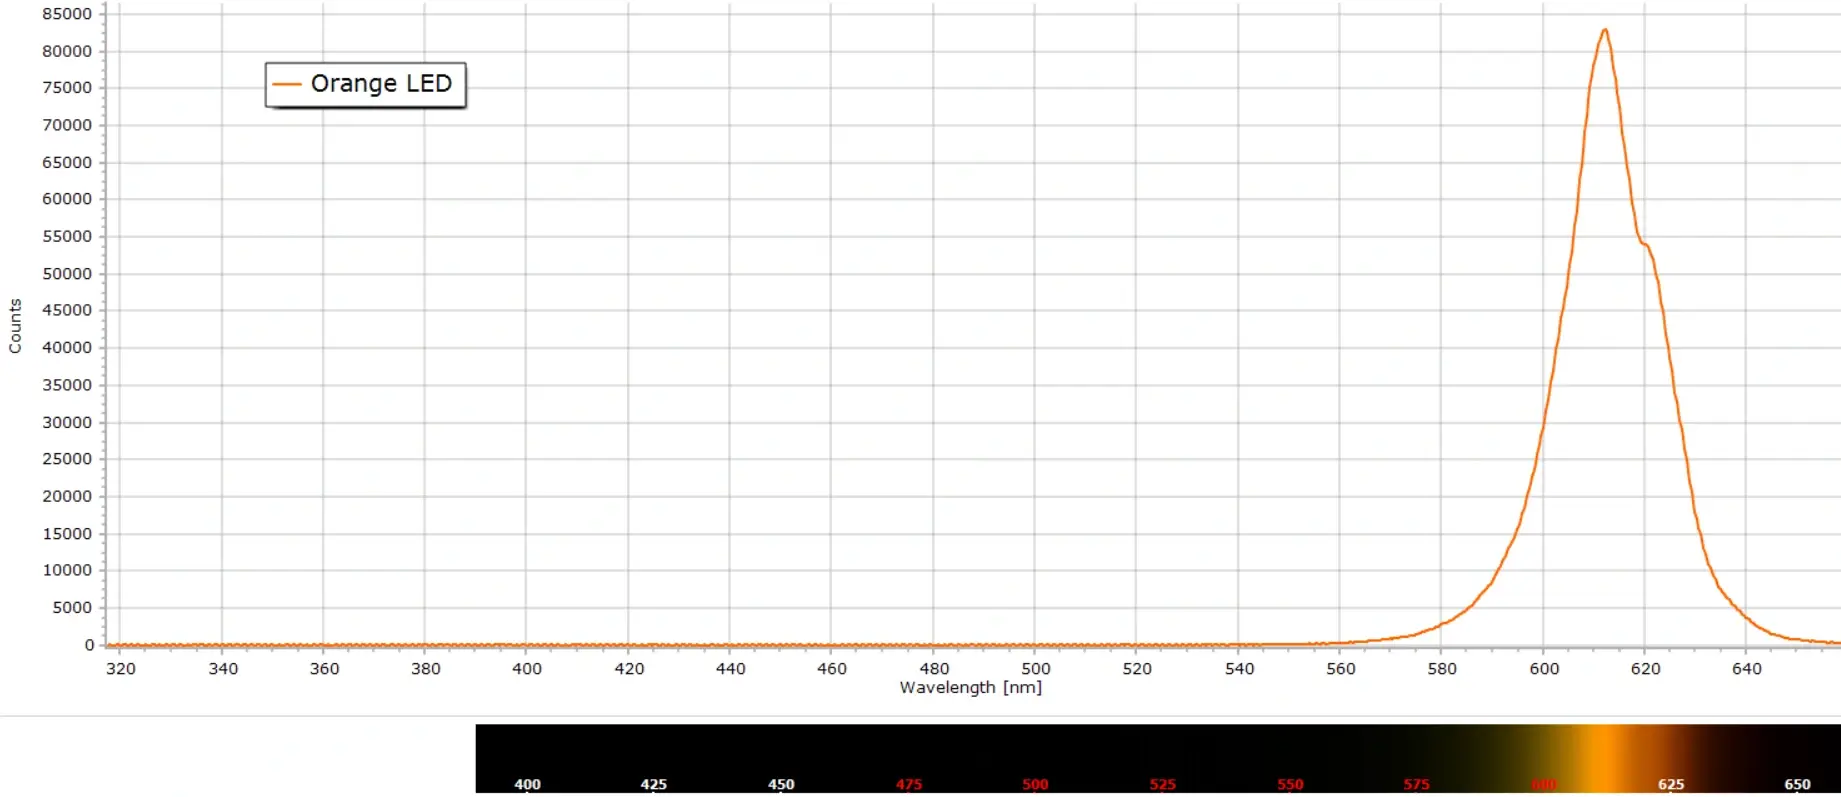
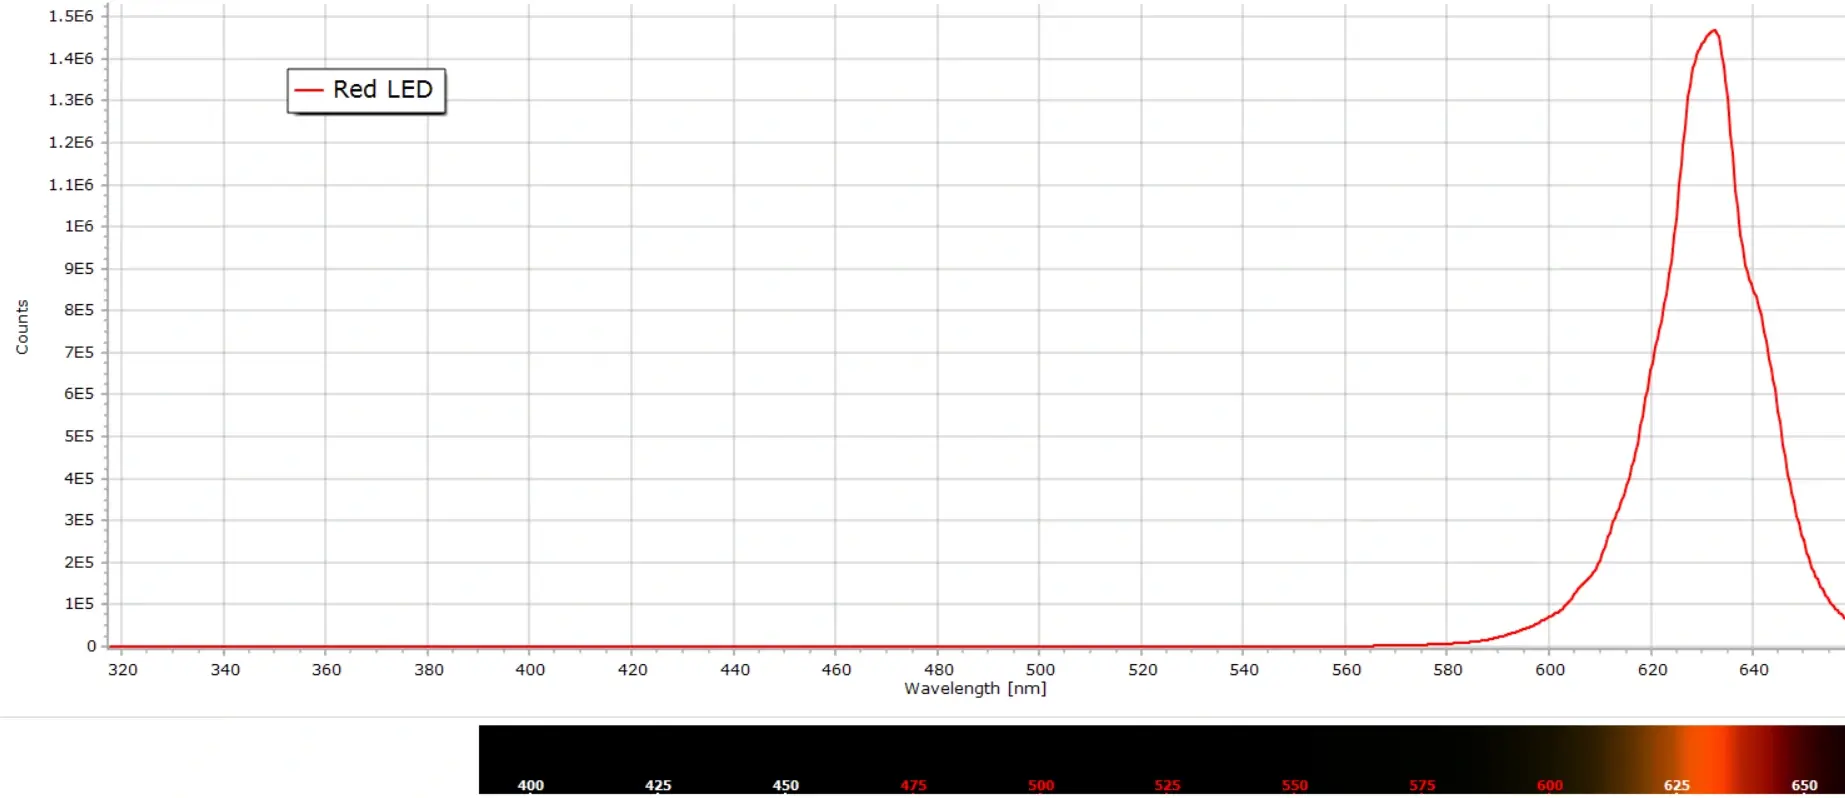
Today’s LEDs typically have clear plastic cases and the diode itself emits light of a particular colour. Here are are few examples. (Not sure why the colour of one of them is referred to as “chartreuse”)
Fig. 1 - 3mm LEDs often used in electronics projects
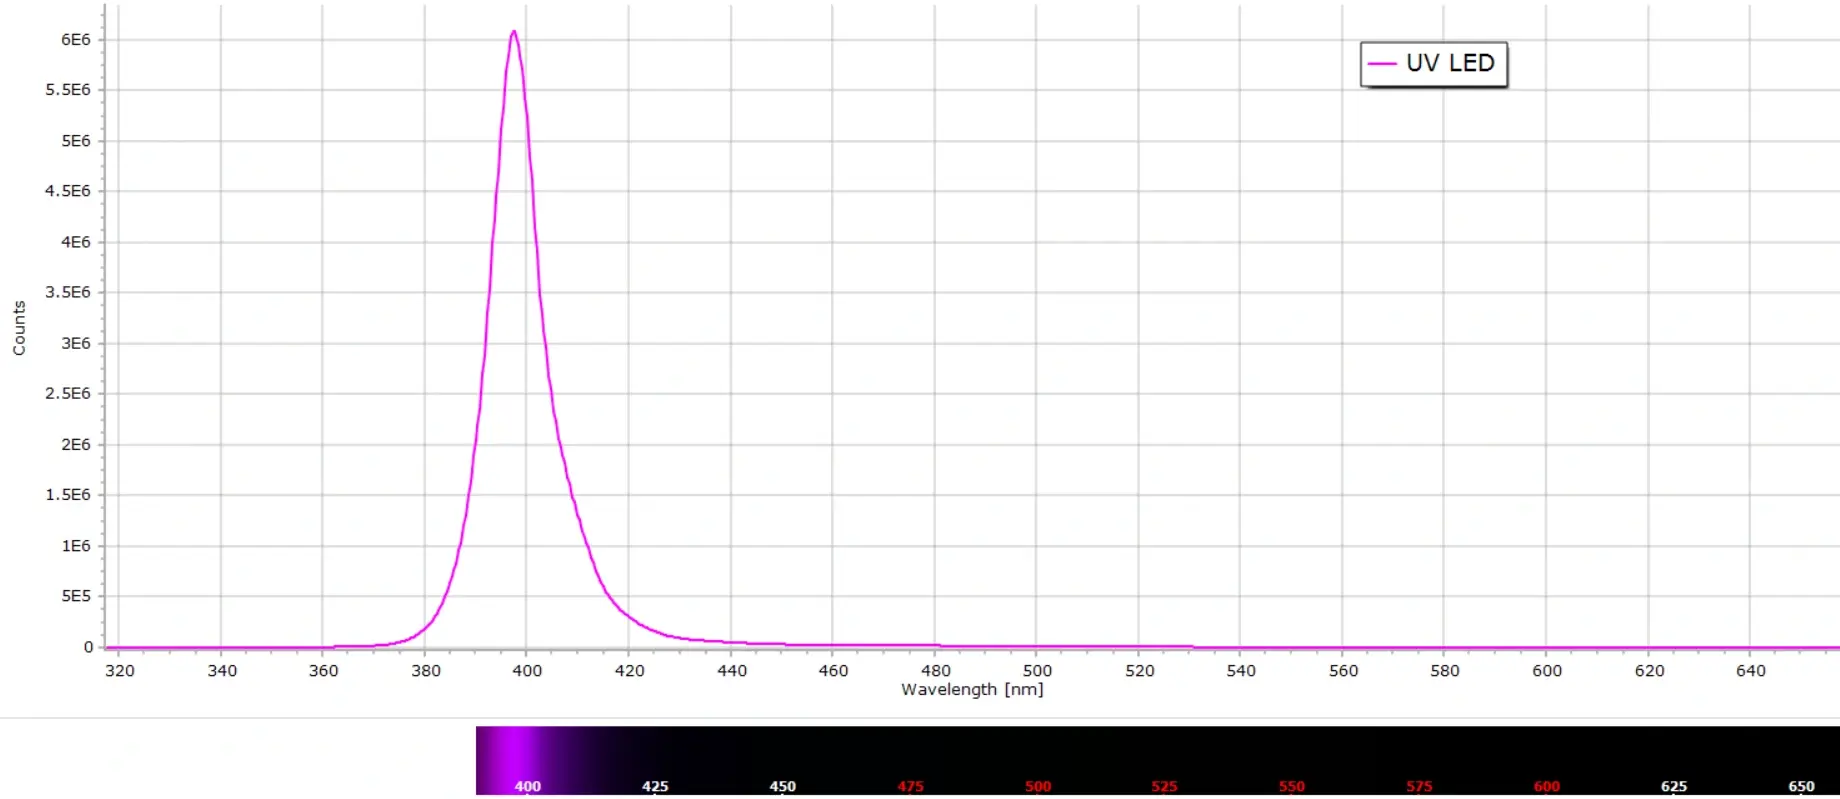
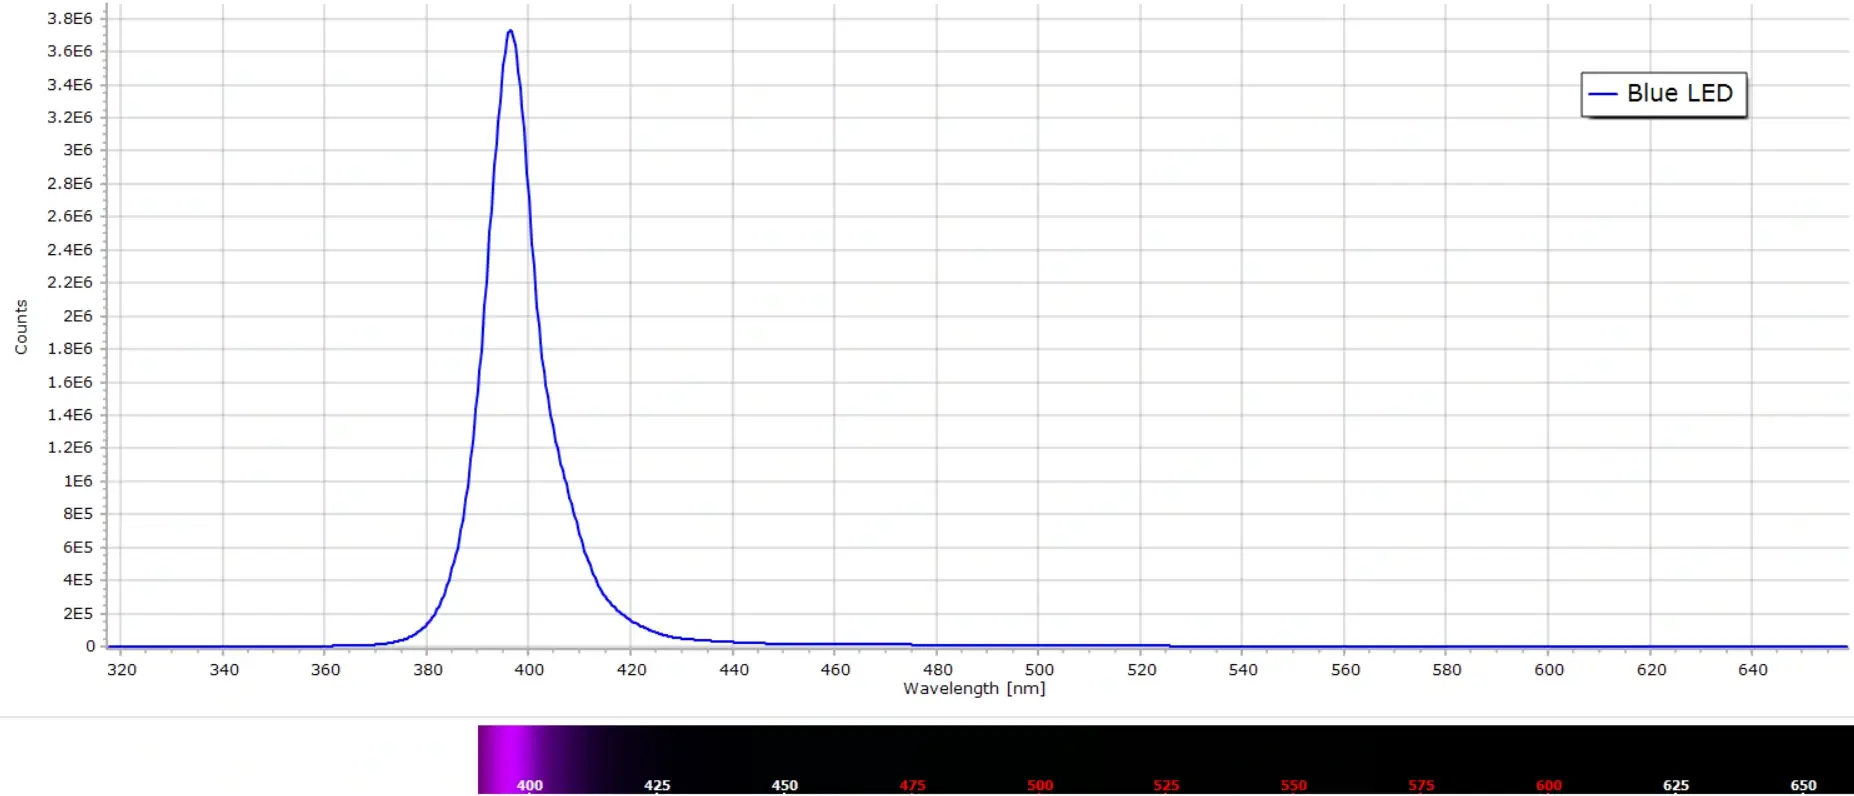
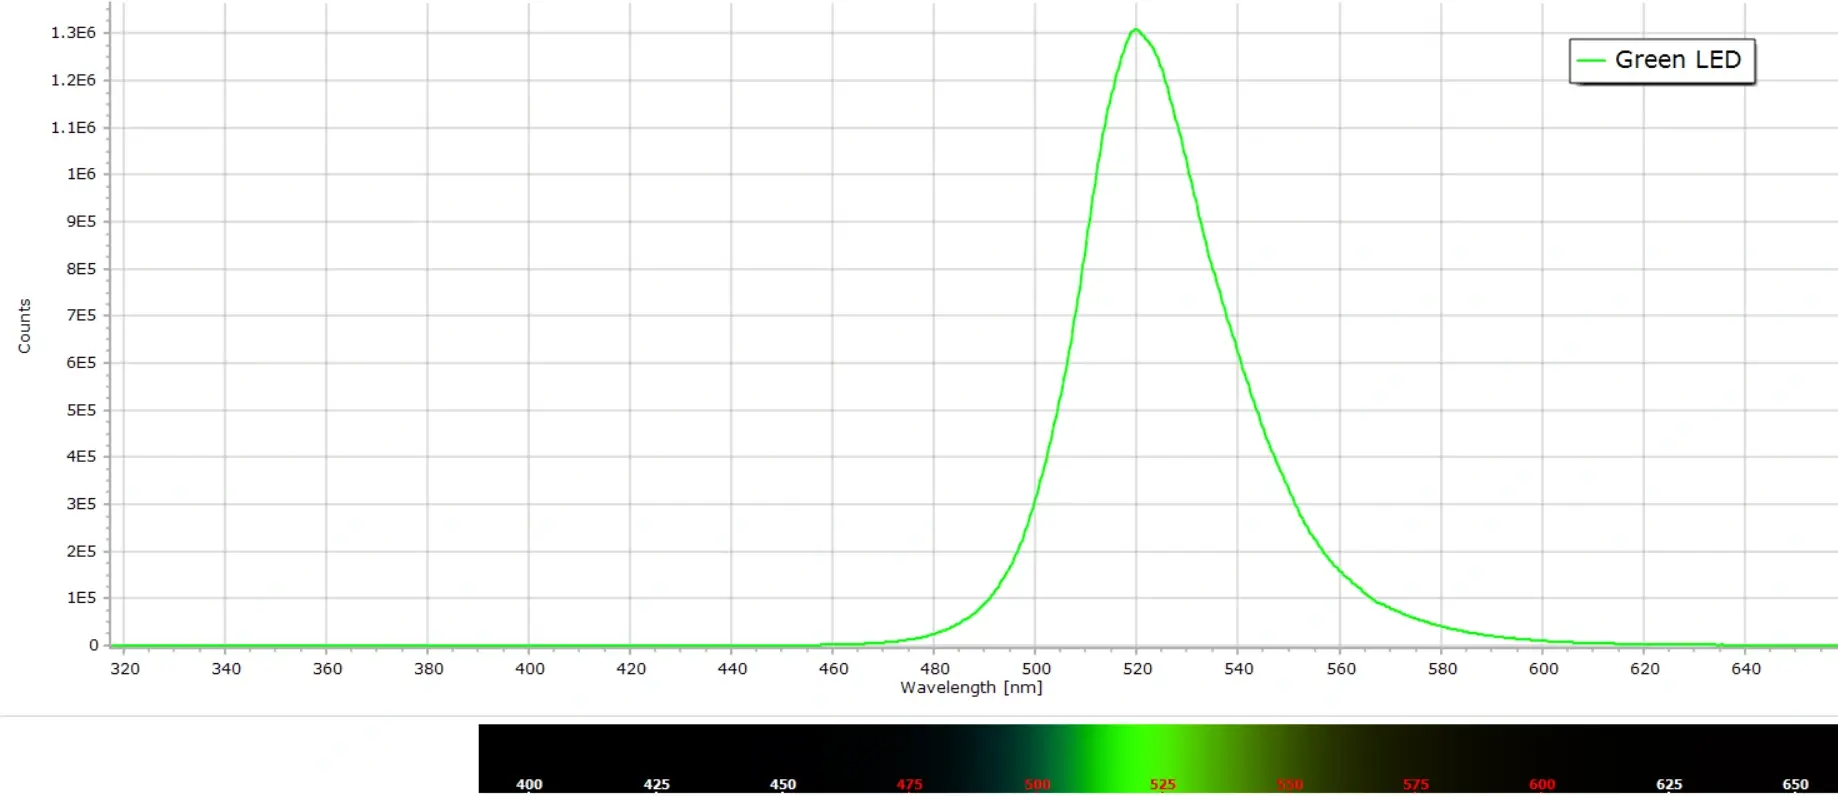
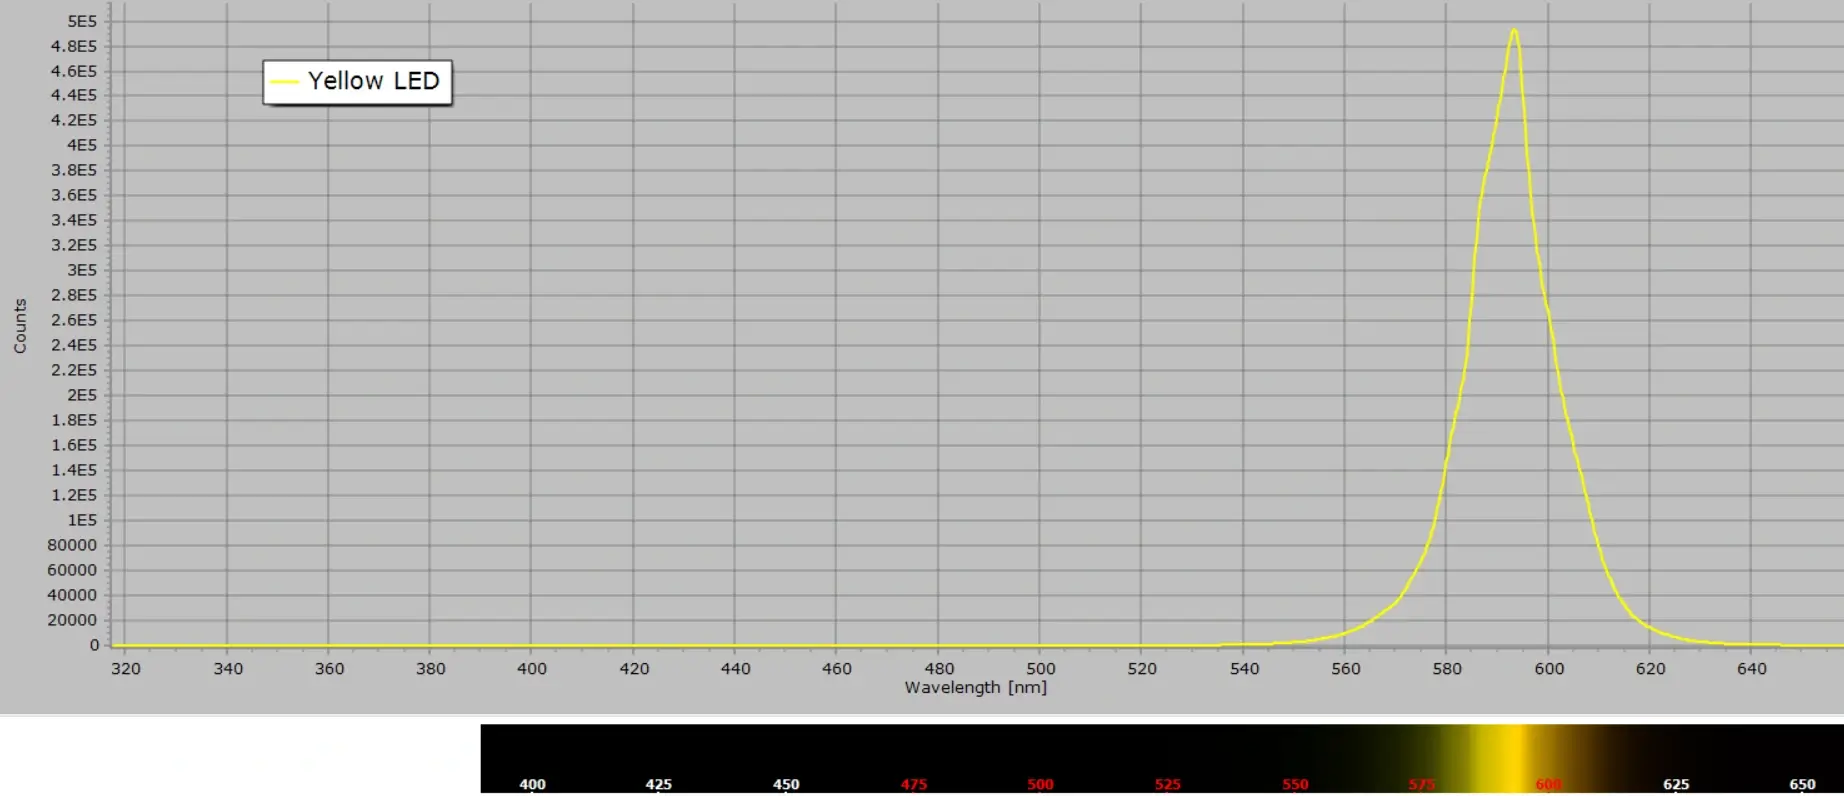
The emission spectra of each of these single 3 mm LEDs is shown in the following image gallery. The first one, which is claimed to be a UV LED, is in reality virtually identical to the blue LED.
This above gallery of LEDs, normalized in intensity units, is shown in this next image for comparison:
Fig 2. Emission band maxima from a series of LEDs
Fluorescent Tube Lighting
Earlier this year, after many years of use, I had a new fitted kitchen installed in my home with all the cupboards, worktops, shelving, lighting, etc. The light fittings in the original kitchen came with fluorescent tube lighting (left image). The new kitchen cupboards inevitably came with more modern LED lighting (right image).
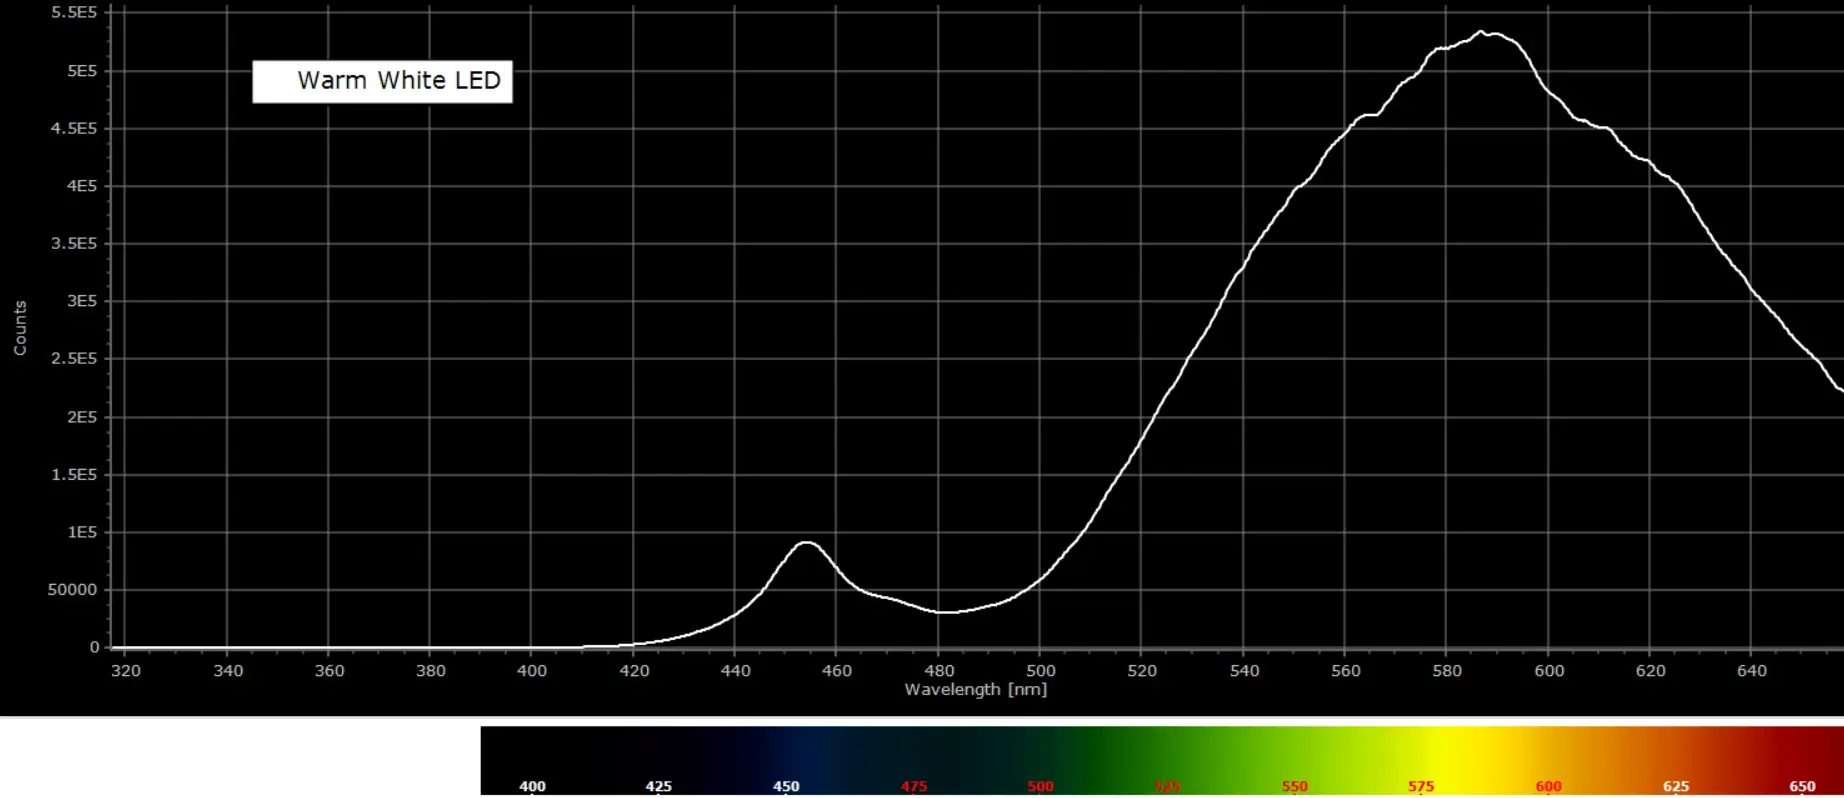
Here is a comparison of the spectra of these two light sources:
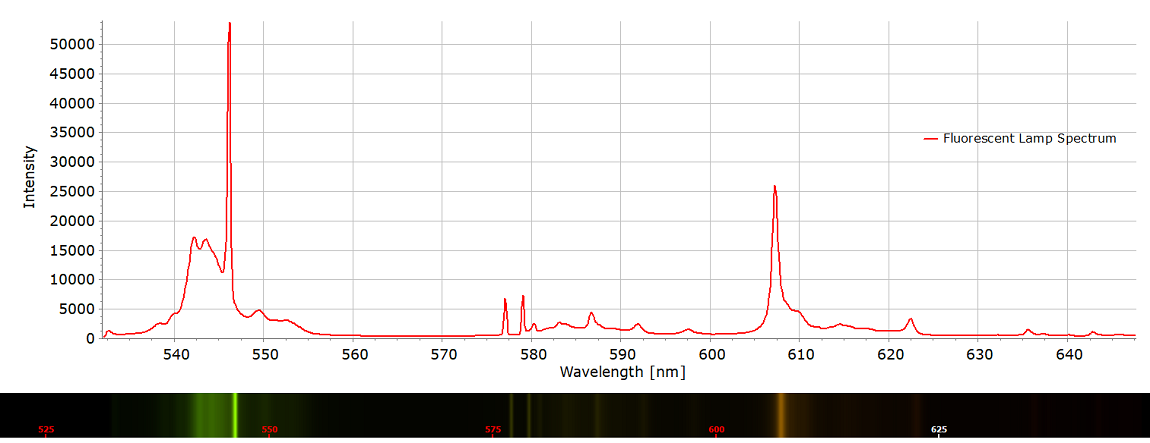
Fig. 3 Regular fluorescent tube
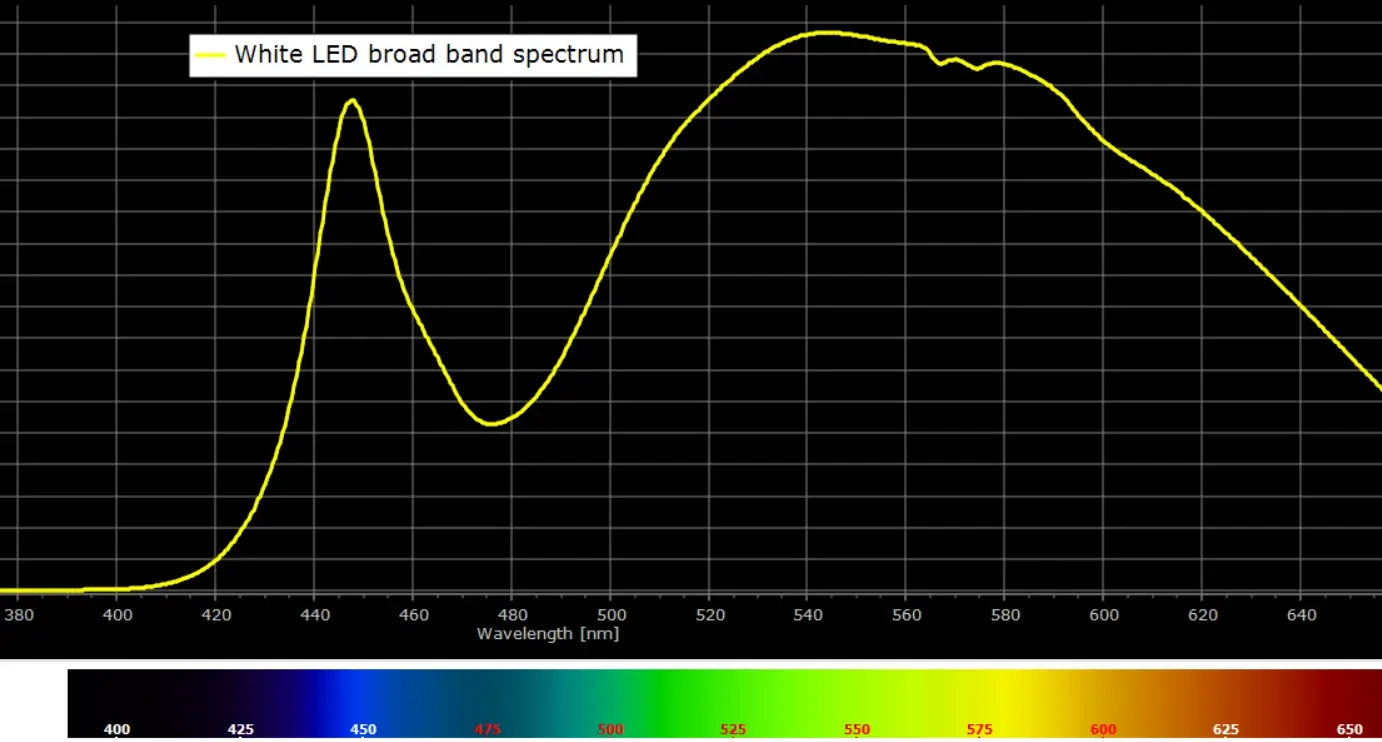
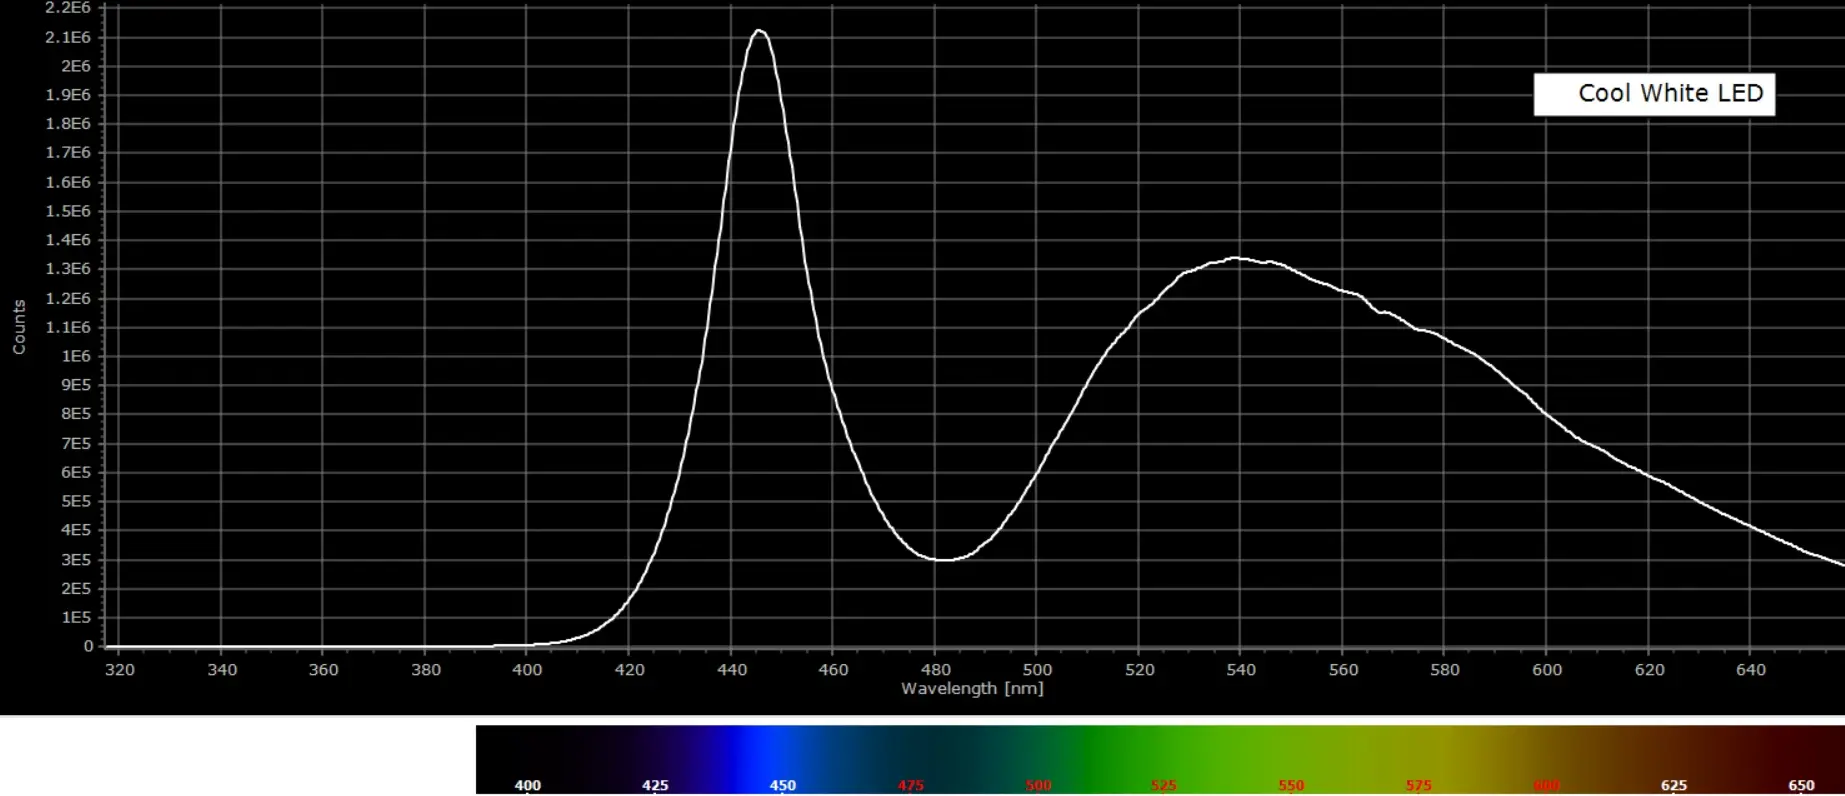
Fig. 4 White LED
The fluorescent lamp spectrum (Fig. 3) has the characteristic mercury lines at 546 nm and the doublet at 576 and 579 nm. Other weaker lines and the strong line at 608 nm are due to neon.
The broad spectrum in Fig. 4 identifies this as a warm white LED.
Toothbrush Sterilizer
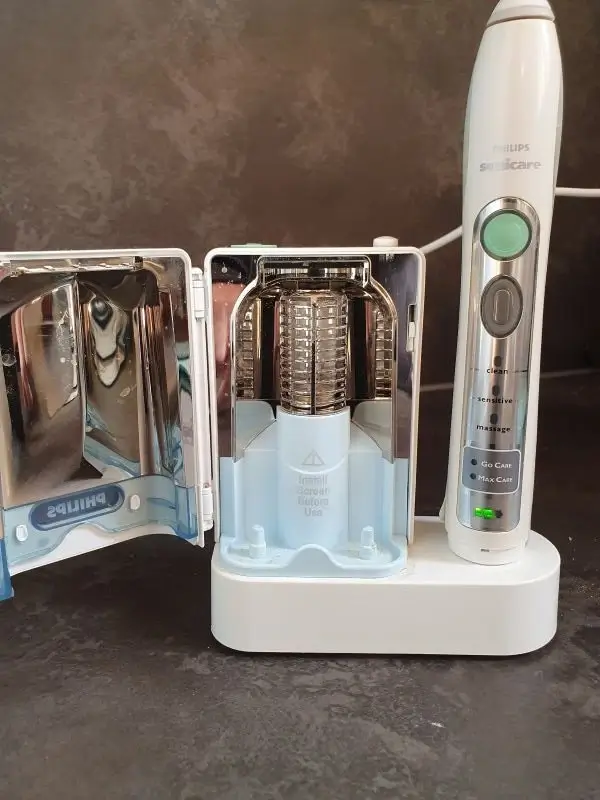
Ultrasonic toothbrushes have been popular for many years. Often, they are sold with a sterilizing unit that is claimed to kill bacteria on the brush. These are usually small UV lamps that irradiate the brush for several minutes on a timer.
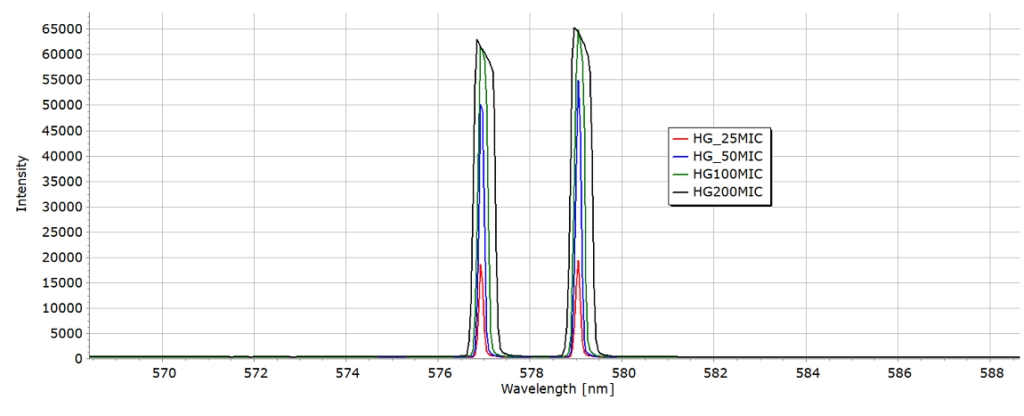
The UV lamp spectrum clearly identifies mercury (Hg). The strong emission line at 546 nm and the weaker doublet at 576 and 579 nm are characteristic of Hg.
Now I am not a microbiologist or bacteriologist. Nevertheless, I would be curious about the efficacy of this lamp as a sterilizer, because the UV lines in the above spectrum are quite weak relative to those in the visible region from 400 nm onwards. There is some loss in sensitivity from the CCD sensor used to record the spectrum as we move into the UV, and this could account for the lower intensity of the UV lines. However, the QE (quantum efficiency) of CCD chip is still about 30% at 350 nm and so the Hg line at 365 nm is still easily captured.
There is another fairly strong line at 254 nm which is not shown in the above spectrum. Exploring these deeper UV lines may be the next exploratory step to conclude that this gadget is an effective sterilization source.
Colour CRT Monitor
The CRT (Cathode Ray Tube) display or monitor was historically the only means of producing TV and computer images prior to the turn of the last century. Beginning in the late 1990’s and early 2000’s, CRT’s began to be replaced by liquid crystal displays (LCD’s), initially for laptop computers and more gradually with large TV monitors. Nowadays, it is likely to be difficult to purchase new a TV or computer monitor based on CRT technology, which uses a vacuum tube, although they are still manufactured for specialized applications. All displays intended for the consumer entertainment and electronics market employ LCD, Plasma or OLED displays.
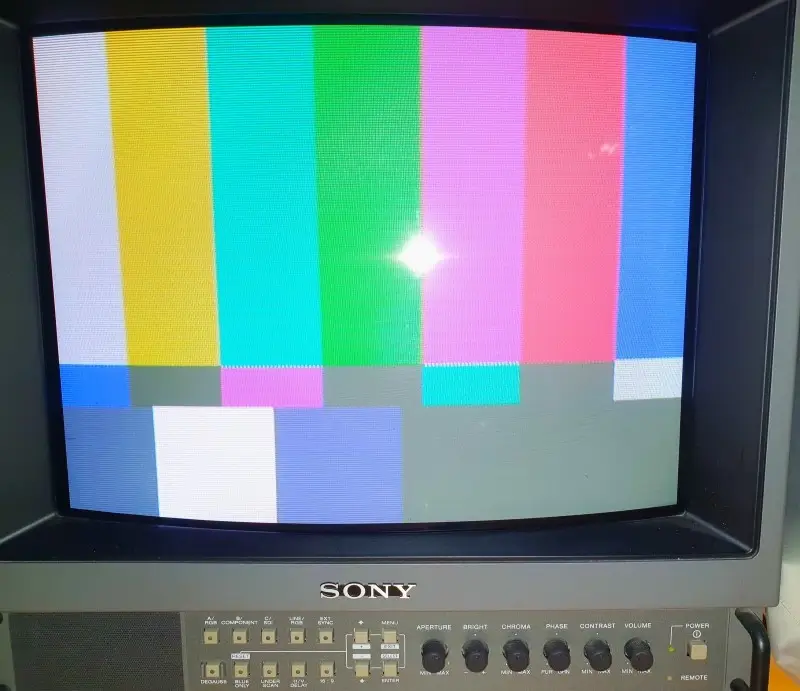
I recently retrieved an old colour TV monitor that was gathering dust in a cupboard, to record the spectrum of the screen from the standard SMPTE test card, or test pattern, of vertical coloured bars. The pattern was generated from a Sony Trinitron 14-inch monitor shown here:
Fig. 7 Sony HD Trinitron monitor with test pattern
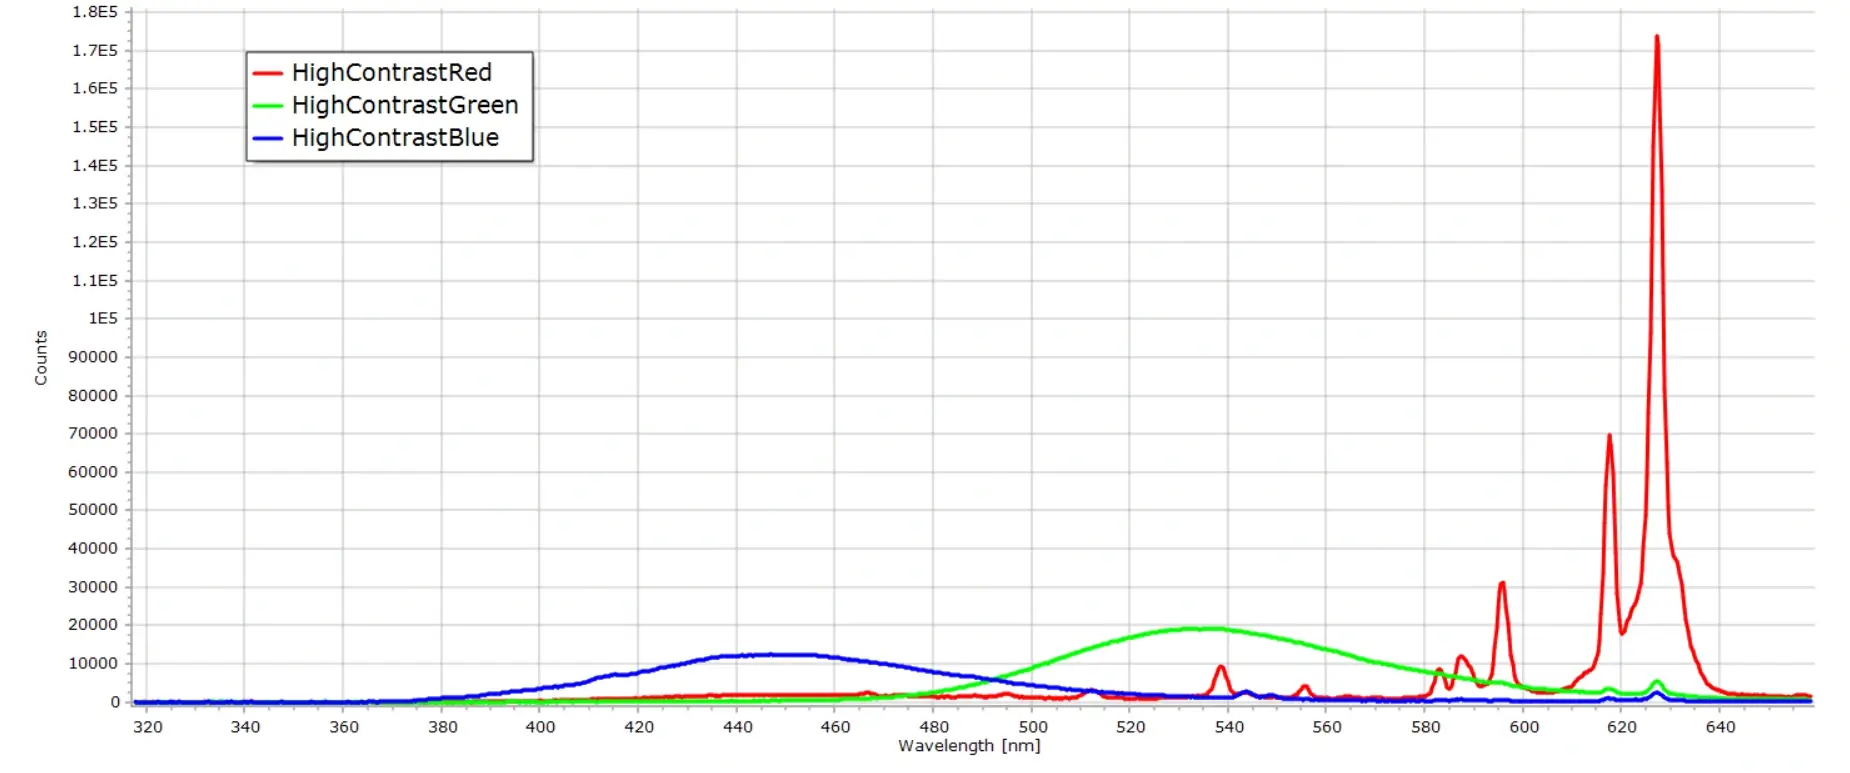
Now initially you might expect the spectra to reflect the specific colours of the bars in test pattern. But with a CRT this is not the case. Colour CRT’s usually consist of three electron guns (one for each primary colour) under high vacuum, and the “display” is a screen with different coloured phosphor materials deposited on the screen during manufacture. Phosphors for CRT’s are usually europium and yttrium oxides doped with other elements. The phosphors generate light when hit by electrons and varying the intensity of the electron beams on a particular spot on the screen generates a particular colour.
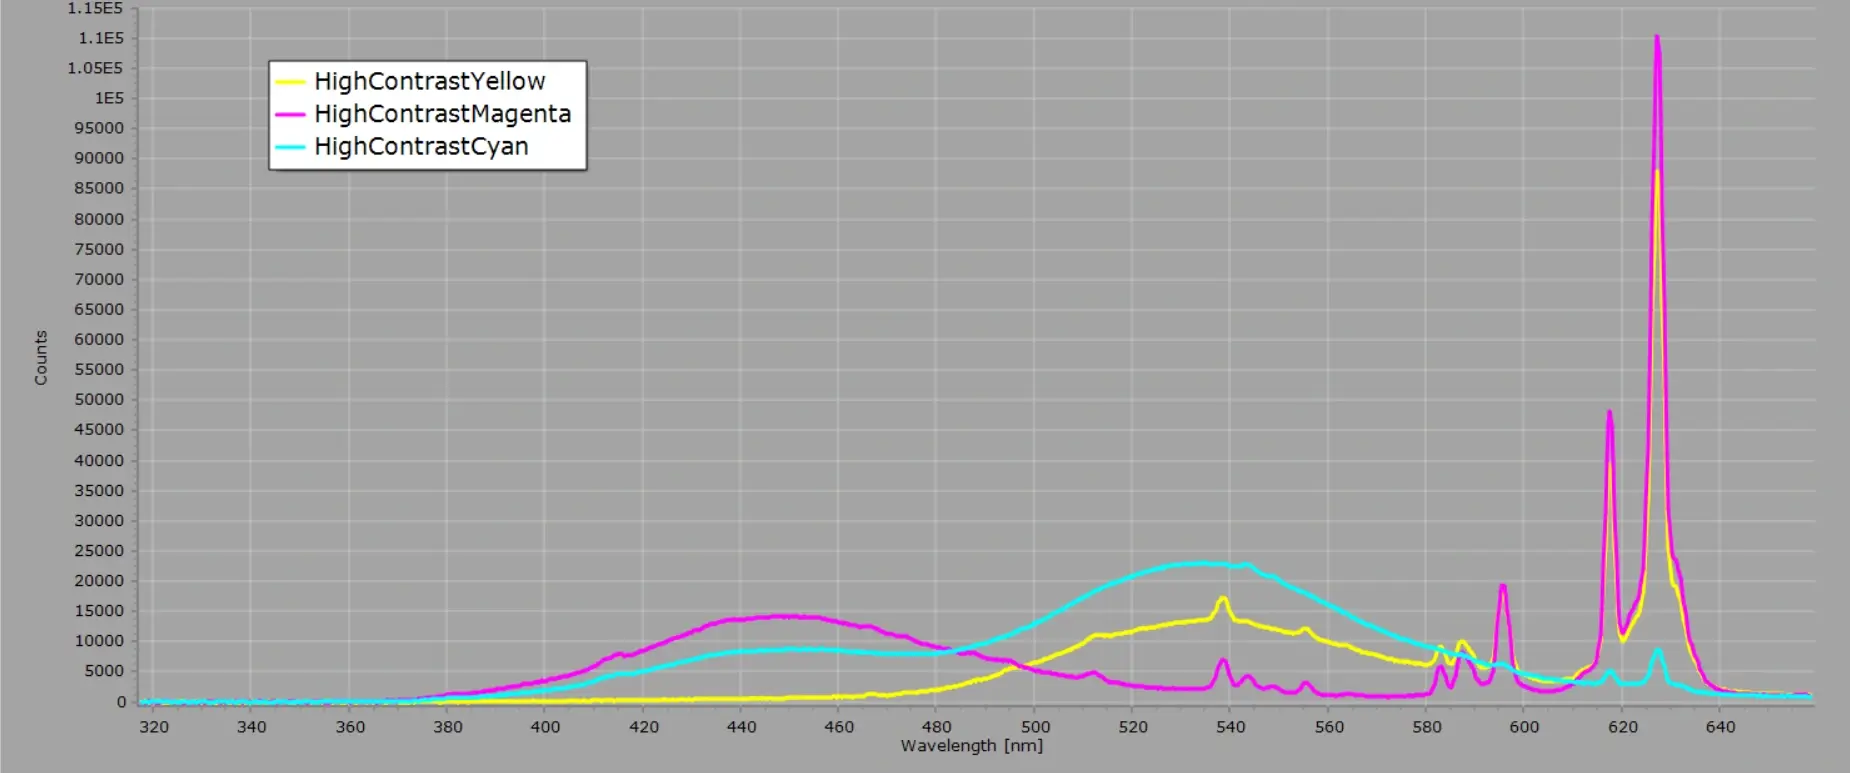
Therefore when we record the spectrum of one of the “colour” test bars on a CRT screen, we are recording the spectrum of the phosphors. Only the intensities of the phosphor emission lines change as we move from one colour bar to the next. This can readily be observed in the following two images:
A more complete description of CRT displays, their historical development and manufacture, is provided here.
Black Lamps
Black lights or black lamps have been mentioned in other posts on this site. They are very useful, inexpensive near-UV lamps for performing some simple experiments as well as their main use in detecting your pet stains around the home.
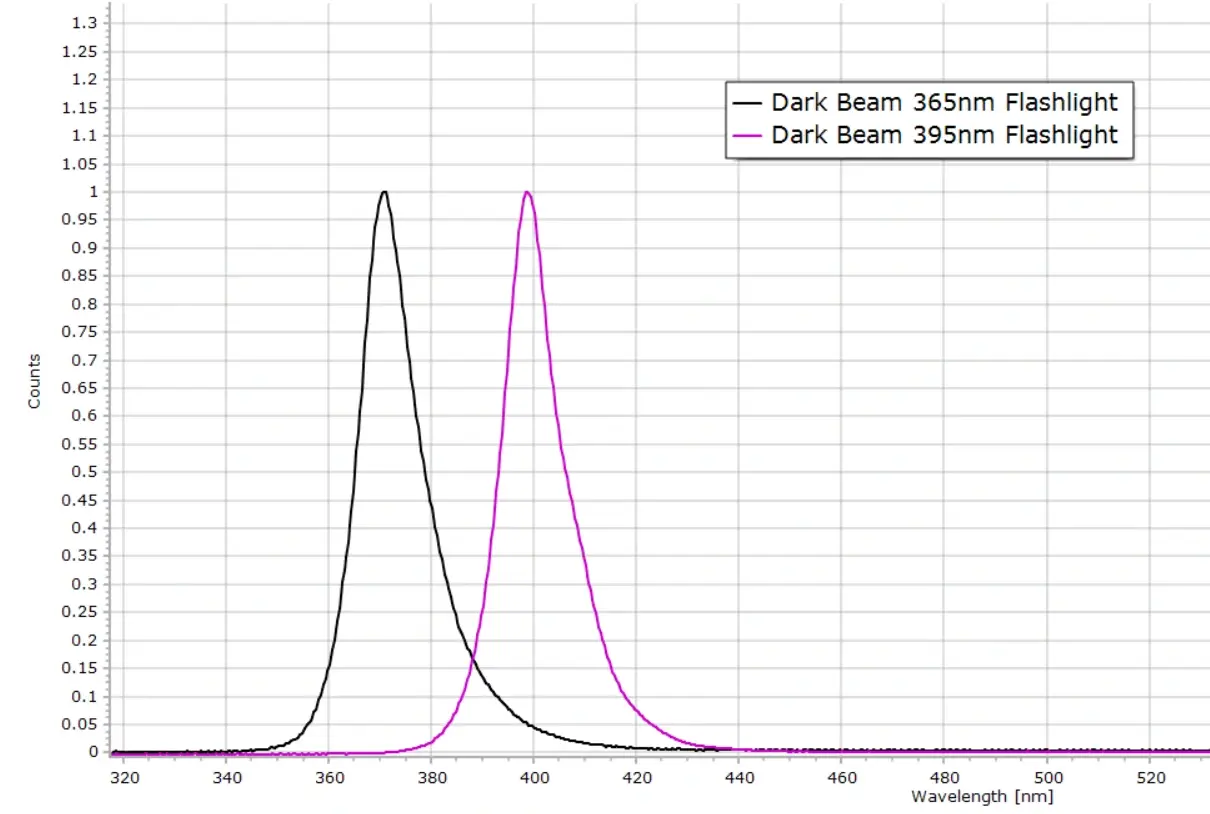
Here are the emission spectra of two popular models sold by DarkBeam and available from Amazon.
The manufacturers of these two flashlights claim the peak wavelengths for the two lamps to be at 365 nm and 395 nm. The measured spectra, however, which were carefully calibrated in wavelength using a professional Hg calibration lamp, show peak emissions at 370 nm and 398 nm for the 365 and 395 models respectively.
The lamps will still be highly effective for their intended use, but the company should be a little more honest with their claims. Some slight exaggeration by the marketing department perhaps. 😉
Camera Flash
This is an interesting one…
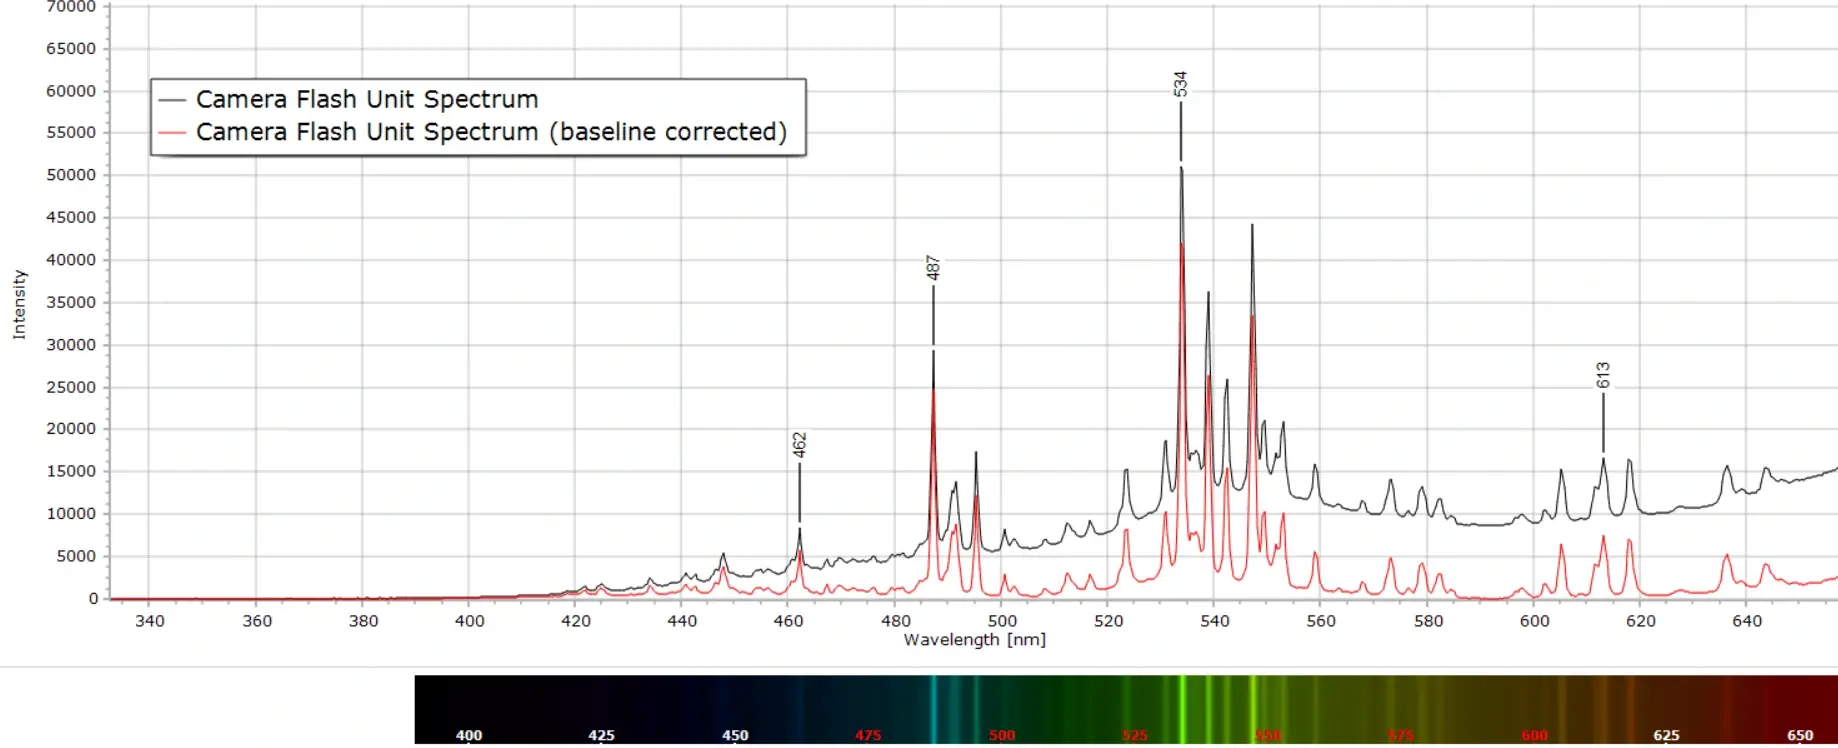
I recently recorded the spectrum produced from the millisecond duration flash from an old camera flash unit. This unit had been kept in a cupboard for far too many years to remember, used back in the days of silver halide film photography.
Fortunately, the two AA batteries from the flash unit had been removed, otherwise the batteries would almost certainly have degraded and leaked after years of disuse, corroding the contacts and making the unit useless.
Camera flash tubes such as this contain the inert gas xenon at relatively low pressure and a capacitor charges to a high enough voltage to cause breakdown and rapid conduction trough the tube to produce the flash. The flash duration is typically a few milliseconds.
The spectrum shown below was captured using the transient recording capability of one of my older spectrometer detectors and software: the Oriel InstaSpec IV described in this article with its associated DOS software… yes, that old dinosaur Microsoft DOS is still around. And even still works!
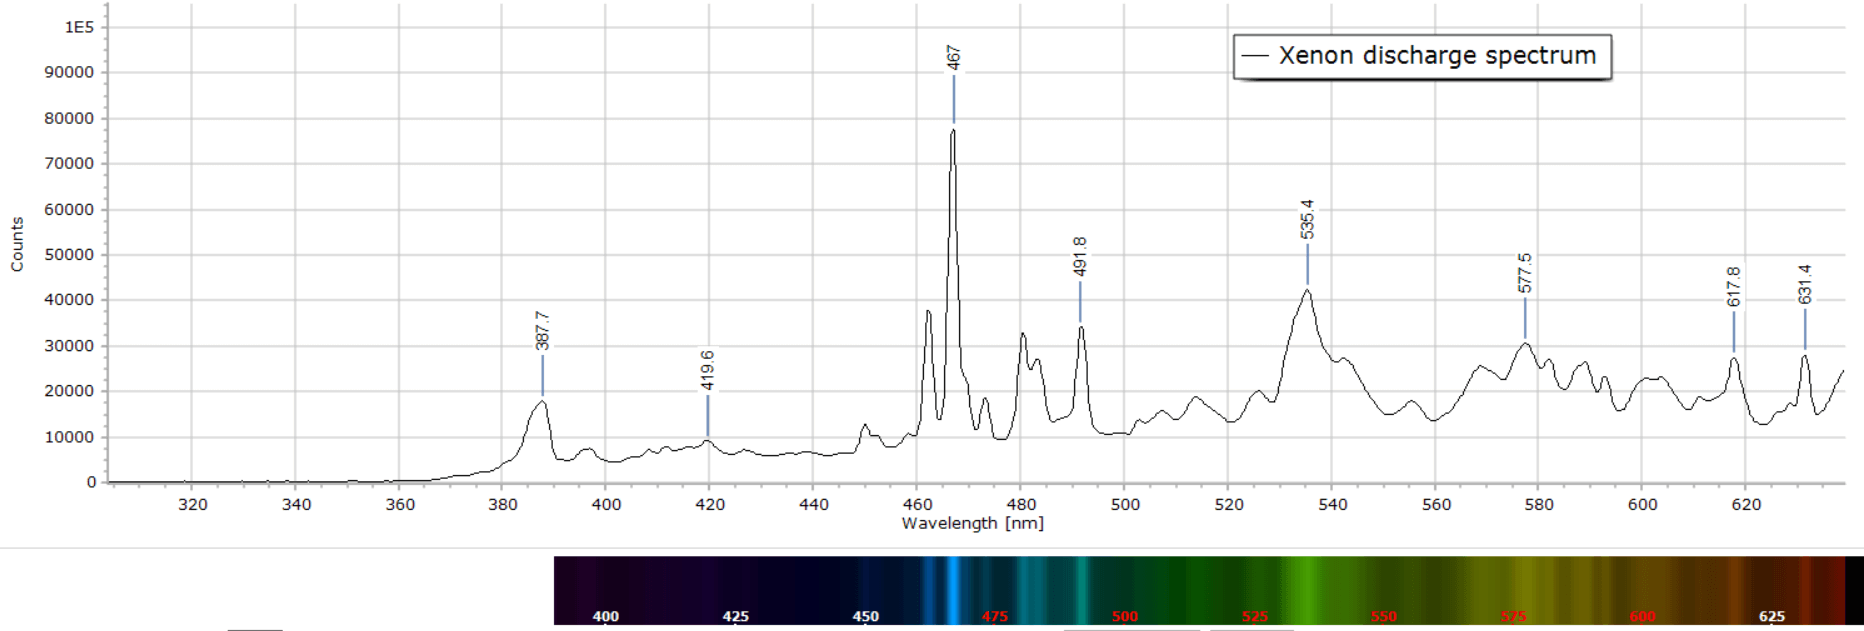
It is interesting to compare this flash gun spectrum produced here with one from a xenon gas discharge (second spectrum) that came from a spectrum tube described in this post. It is reproduced here for comparison:
Emission line wavelengths are the same within the experimental uncertainty of about ±1 nm. However, the lines in the discharge are very significantly broadened compared to the lines from the camera flash. This is because with the flash tube the discharge only lasts a few milliseconds and produces well defined, spectrally resolved lines. The spectrum tube discharge, on the other hand, is running continuously. This results in significant line broadening, called collision broadening, since the Xe atoms are continually colliding with each other in the various excited energy states.
A more detailed explanation of the widths and shapes of spectral lines is provided in this article.
3 Minute ReadThis is a quick post that examines the spectral line emission changes that occur when a Mercury-Argon (Hg-Ar) gas discharge lamp is switched…
7 Minute ReadIntroduction There are a number of technical constraints to consider when selecting a spectrometer for a particular application, whether this involves purchasing a…

