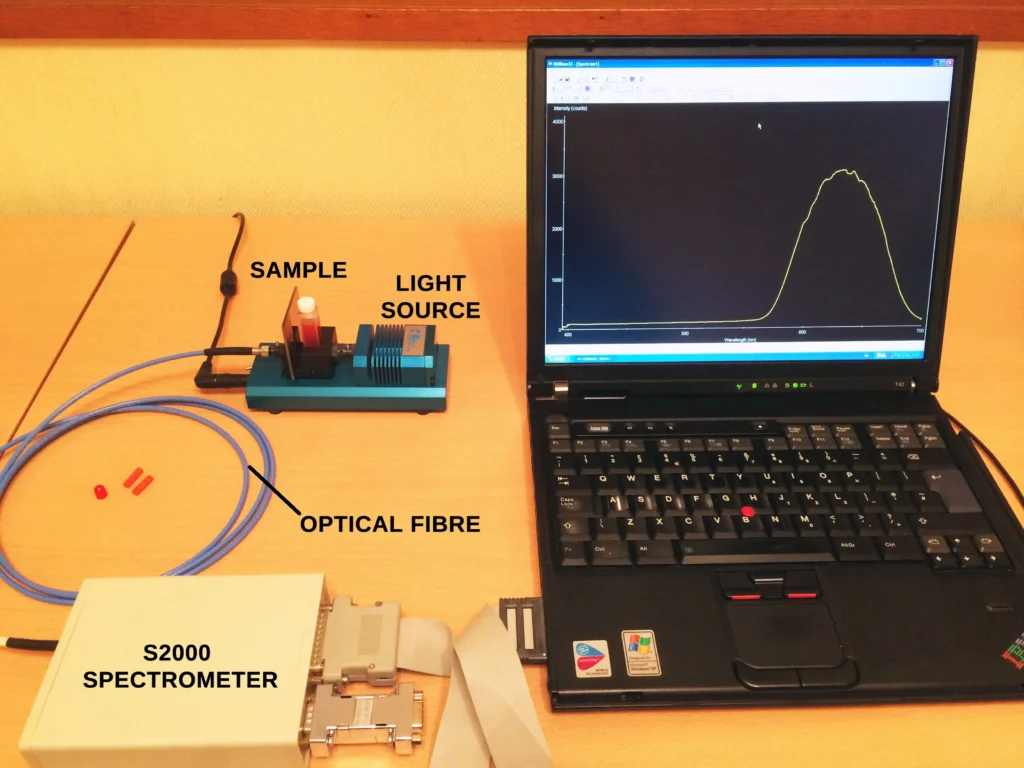
This is a quick post that examines the spectral line emission changes that occur when a Mercury-Argon (Hg-Ar) gas discharge lamp is switched on and warms up. I used the Time Acquisition mode of an Ocean Optics S2000 fibre-optic spectrometer to record the changes in intensity of 3 spectral lines after the lamp is switched on. This mode is useful for doing kinetics experiments spectroscopically. The results are depicted in Figures 1 and 2.
Fig. 1 Time Evolution of the 435nm, 546nm and 576nm Hg Lines
So what is happening here?
The Hg(Ar) lamp consists of a mixture of mercury vapour and argon gas. The argon acts as a sort of “primer” employed to kick-start the electrical discharge because it more readily gets excited by the discharge initially since it is already in the gaseous phase (the natural state of mercury at room temperature and pressure, known as RTP, is a liquid).
Initially, emission lines from argon become visible the instant the lamp is turned on. These quickly disappear after a few minutes (sometimes seconds depending on the lamp model and type) as the pressure of mercury vapour in the lamp increases and Hg lines begin to dominate the spectrum.
Basically, the electronically excited argon atoms are de-activated by collisions with mercury atoms in non-radiative transitions back down to the ground state as the concentration of mercury vapour atoms increases.
The yellow trace in the top figure is the actual emission spectrum showing 5 mercury lines at 404, 435, 546, 577 and 579 nm when the lamp has fully warmed up after about 20 minutes. Argon lines are no longer visible since they are too weak.
The three red curves are the kinetics traces monitoring the changes in intensity of 3 of the mercury lines at 435 nm, 546 nm and 577 nm as a function of time. It is interesting to observe that the instant the lamp is switched on there is a sudden burst of Hg vapour in the discharge tube that increases mercury line emission, possibly due to the sudden increase in temperature. The Hg line intensity then falls back before recovering somewhat, falls back slightly again, then increases more gradually until the vapour pressure in the gas tube eventually becomes stable after about 20 minutes – the duration of this kinetics experiment.
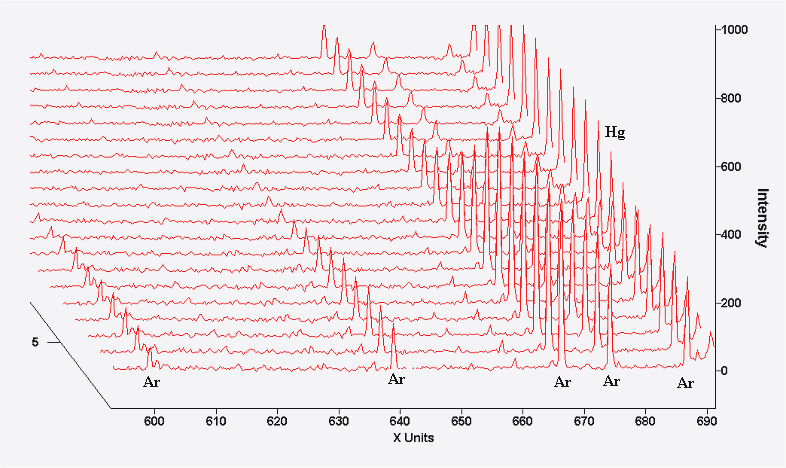
After 20 minutes the discharge has fully stabilized at its operating temperature and pressure. The final images are a 3D plot from 600-700nm showing the decrease in intensity of Ar emission lines after about 35 seconds after the lamp was first switched on. These are not visible in the above spectrum plots since they are too weak in intensity.
Ar lines are not visible in the above spectrum but they can be seen in this 3D plot in Figure 2 that has monitored the time acquisition of the experiment from t=0 to t≈35 seconds.
Fig. 2
A more informative description can be seen in this short video showing the time evolution of these effects. The y axis is intensity units as usual, the x axis is wavelength in nm and the third z axis is time in seconds in this real time plot. The measurement time is approximately 75 seconds.
3 Minute ReadAbsorbance In very general terms, Absorption Spectroscopy is the spectroscopic technique that considers what happens when electromagnetic radiation of any wavelength passes…
9 Minute ReadWhat is Fluorescence? Before we can consider what is fluorescence in scientificterms, we must mention the general process of luminescence. Luminescence is defined…