Introduction
MS125
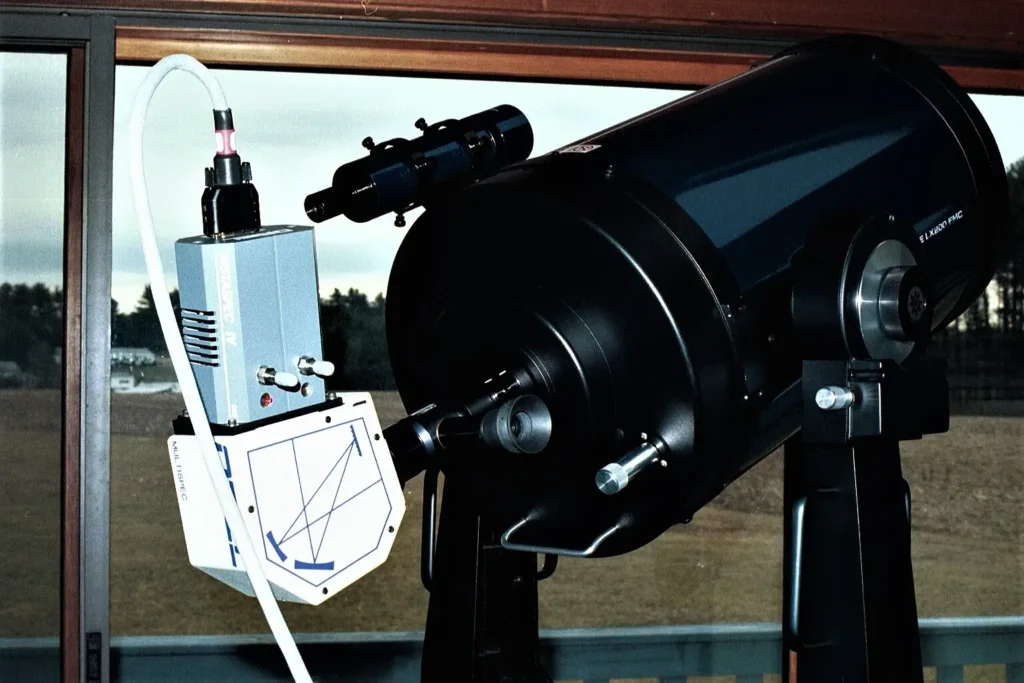
This is a very versatile spectrograph that I have used over the years to record a variety of spectra from various emission sources, astronomical objects and other samples. When it is combined with a linear CCD detector such as the InstaSpec IV™ described here it becomes a sensitive and flexible spectroscopy system.
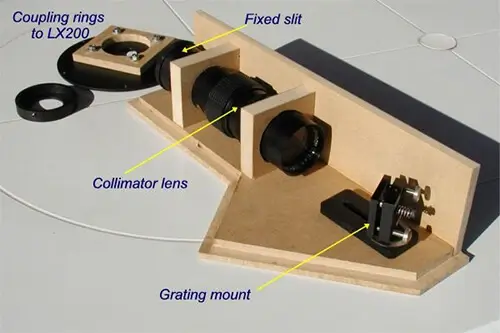
The spectrograph is of the crossed Czerny-Turner design described in more detail in this post) and features internal light baffles to suppress stray light. Figure 1 shows the various components in the design. The spectrometer has a focal length of 1/8 m (125 mm) and a typical resolution of 0.4 nm with a 1200 l/mm grating and 50 μm slit. Its size is slightly larger than many of today’s “hand-held” spectrometers that use optical fibres, whose focal lengths are typically 50-75 mm.
Nevertheless, the MS125 is still a very compact design and has been optimized for use with linear array detectors such as the InstaSpec IV CCD detector shown in these images as well as generic photodiode detectors. Below are two closeups of the internal workings of the spectrograph coupled to an InstaSpec IV™ CCD detector:
The MS125 has two big advantages in terms of flexibility: both diffraction gratings and entrance slits are fully interchangeable.
The optical resolving power or resolution of a modern spectrometer is essentially determined by its overall focal length, by the slit width used to record a spectrum, by the dispersion of the grating in grooves (lines) per millimetre and by the number of horizontal pixels representing the detector.
Thus with careful selection of the slit and grating for a particular application, the optical resolution can be fully optimized. With a 600 l/mm grating the full range of the visible from 400 – 700 nm is available and the slit width will then determine the final resolution.
If the light source intensity entering the spectrometer is low, increasing the slit width will improve the signal-to-noise (S/N) ratio but at the expense of spectral resolution. If higher resolution is required in a specific wavelength region, a higher dispersion grating such as a 2400 l/mm can be used and the slit width selected depending on light signal intensity.
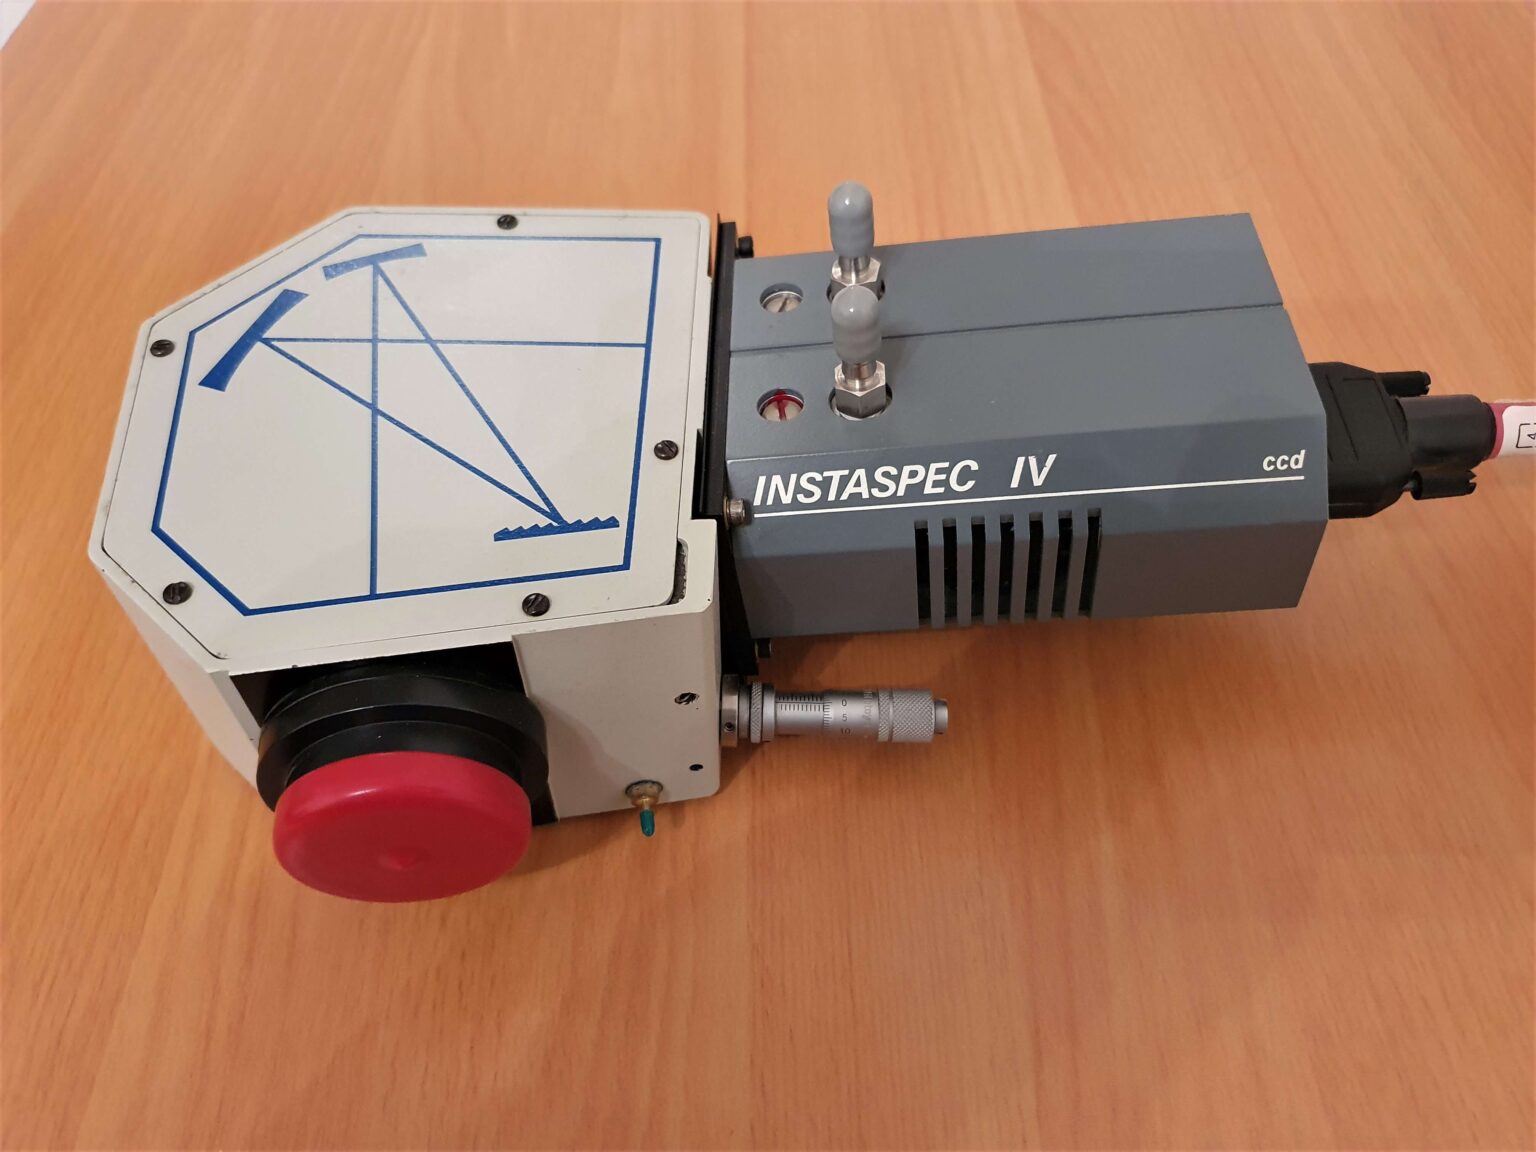
The InstaSpec IV
The business end of the detector can be seen in Figure 5. The sensor is a Hamamatsu S5769 chip with 1024 x 64 pixels. Each pixel is 24μm square. These are not sensors for taking pretty pictures. The limited number of only 64 pixels in the vertical direction indicates that they are specifically designed for recording dispersed light signals – their aim is to capture spectra.
Having said that, this particular sensor does in fact have some limited vertical spatial resolution capability that is controlled by the software. In this way it is possible to record spectra from extended light sources such as flames or different physical regions within the same source. These can be binned (grouped) into a series of rows that are factors of 64, e.g. 2 rows of 32 pixels high, 4 rows 16 pixels high, etc…
The sensor exhibits the expected drop in quantum efficiency in the blue that is typical for a front-illuminated CCD of this type. Nevertheless, it is sensitive enough to readily detect the hydrogen Balmer series of emission lines Hδ and Hε at the blue-violet end of solar spectrum, for example.
The sensor is cooled with a single stage Peltier element that can lower the temperature (and therefore dark current) down to about -10°C from an ambient 20°C. The temperature can be lowered further by water cooling the whole detector if required – the two inlet ports on top of the detector in Figure 5 are for that purpose. The black O-ring is there to provide a light-tight seal against the body of the MS125.
Remember DOS ?
The only inconvenience with this spectroscopy system is that the software only runs under DOS – remember that old dinosaur? Worse still the interface card is a 16-bit full length ISA card that uses DMA (Direct Memory Access) functions in order to work properly. So I have had to keep well maintained and in good digital health my very old Intel 486 desktop PC to ensure the system runs smoothly! Needless to say, I treat the system as a precious child and maintain regular backups of the hard drive!
Typical Line Emission Spectra
Below are a few emission line spectra that can be obtained with this spectrometer:


