Introduction
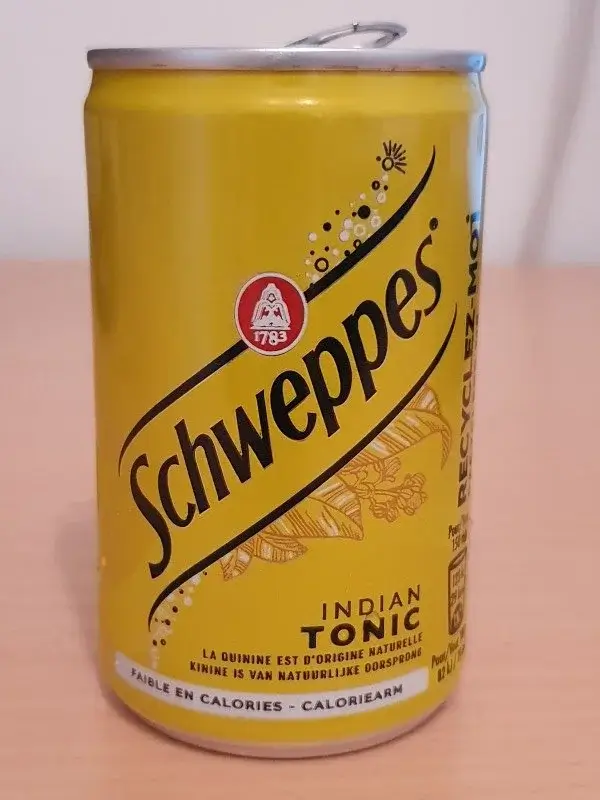
If you enjoy a gin & tonic in the evening after a hard day’s work, then you are consuming small amounts of the flavouring agent quinine. Look closely at the label on any can or bottle of tonic water and you will see that the drink contains quinine:
Quinine fluoresces strongly under UV light as this very short video can confirm. The first glass contains pure water which does not fluoresce. The second contains a popular brand of tonic water which fluoresces strongly:
Background
Quinine was first isolated from the bark of the South American Cinchona tree in the early 19th century when it was discovered to be an effective treatment for malaria. It continued to be used in the treatment of malaria until as recently as 2006, when the World Health Organization no longer recommended it, in favour of other medications.
As a flavouring agent quinine was very popular in the 19th century, dissolved in carbonated water as a preventative measure against the great fear in Victorian times of catching malaria. However, due to its inherent bitterness, a more agreeable ‘partner’ was searched for, and mixing carbonated quinine water with gin made it much more palatable as an alcoholic drink. Thus the iconic gin and tonic cocktail was born, and the rest is history as they say.
Today, the use of quinine in carbonated drinks is regulated because high doses of quinine taken too often can have side effects. For example, the US FDA limits the maximum amount of quinine in drinks to 83 ppm (parts per million). The European Union and other national health authorities apply similar restrictions.
In this demonstration, we are going to measure the amount of quinine in a popular can of tonic water and verify if the Schweppes company, in this example, is following the rules.
Fluorescence of Quinine
As demonstrated in the video above, quinine fluoresces strongly under UV light. A practical way for the home experimenter to measure the amount of quinine in a sample of tonic water is with fluorescence spectroscopy. The photochemical background to fluorescence has been described in detail in this post. Fluorescence methods are generally more sensitive technique than absorption spectroscopy and we can use this high sensitivity to measure the low levels of quinine in a sample of tonic water.
The neutral form of quinine is the free base, whose structure is shown in Figure 1.
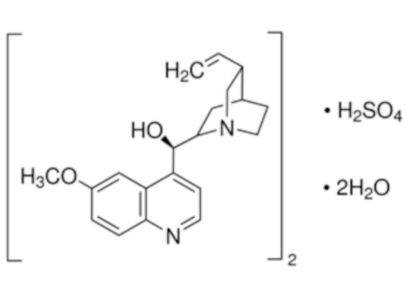
In this form it is only slightly soluble in water. So for most experiments in aqueous solution, it is usually dissolved in dilute acid, such as sulphuric acid. This converts the molecule to the soluble sulphate form with the structure generally represented as:
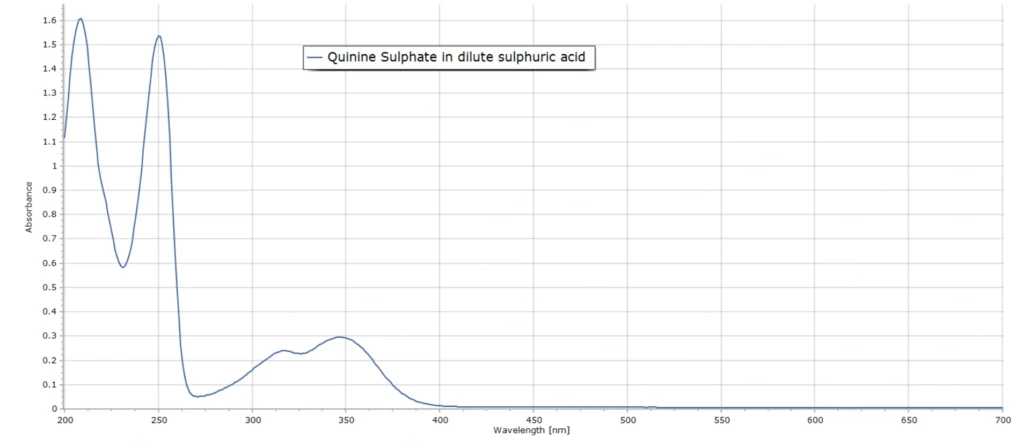
The absorption spectrum of quinine sulphate exhibits several absorption bands in the UV, including a relatively narrow band at 250 nm and a broader band with a maximum around 350 nm (Fig. 2). This spectrum was produced with a commercial dual-beam UV-VIS spectrometer (Perkin Elmer Lambda 25).
The first (short wavelength) absorption band at 250 nm corresponds to an S0 → S2* electronic transition, where S0 is the lowest energy state, called the ground state, and S2* is second highest electronic energy level. The symbol * denotes an excited energy state. The second absorption band corresponds to an S0 → S1* transition. An explanation of these energy transition terms is provided here.
In order actually to generate a fluorescence (emission) spectrum of quinine, we therefore need to use a UV light source that covers one or both of these absorption bands at 250 nm or 350 nm in Figure 2.
The 250 nm band is in the deep UV (also called UV-C) and specialized light sources and UV protection are required. Fortunately, the 350 nm band is in the relatively near ultra-violet and we can use a low cost UV LED lamp to excite a quinine solution, as seen here…
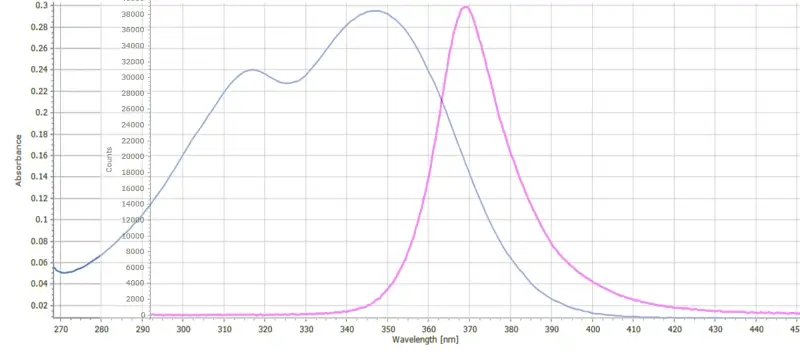
Figure 3 indicates the overlap between the UV LED emission band and the near UV absorption band of quinine. There is sufficient spectral overlap here for UV LED light photons to be absorbed by quinine molecules and subsequently fluoresce.
This fluorescence features a broad emission band centered around 450nm and extending well into the green. The fluorescence spectrum will always be red shifted to a greater or lesser extent relative to the absorption spectrum. See this post on Kasha’s Rule and the Stokes Shift for an explanation. The band maximum remains the same irrespective of the excitation wavelength. The fluorescence intensity itself will depend on the relative strength of the absorption but will always be centered around 450 nm.
Experimental Setup
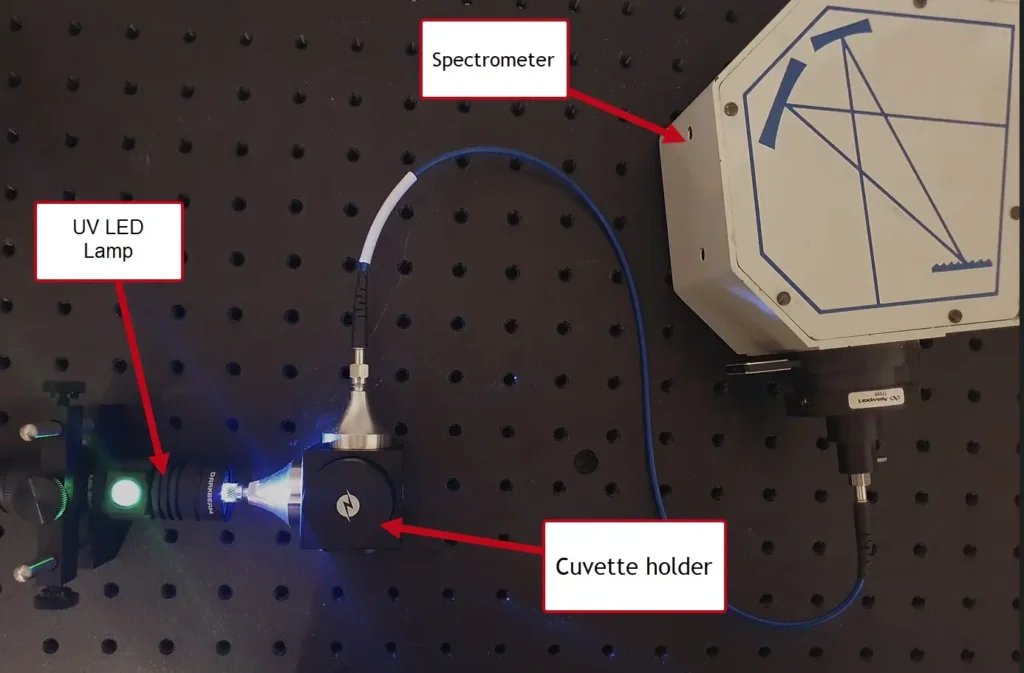
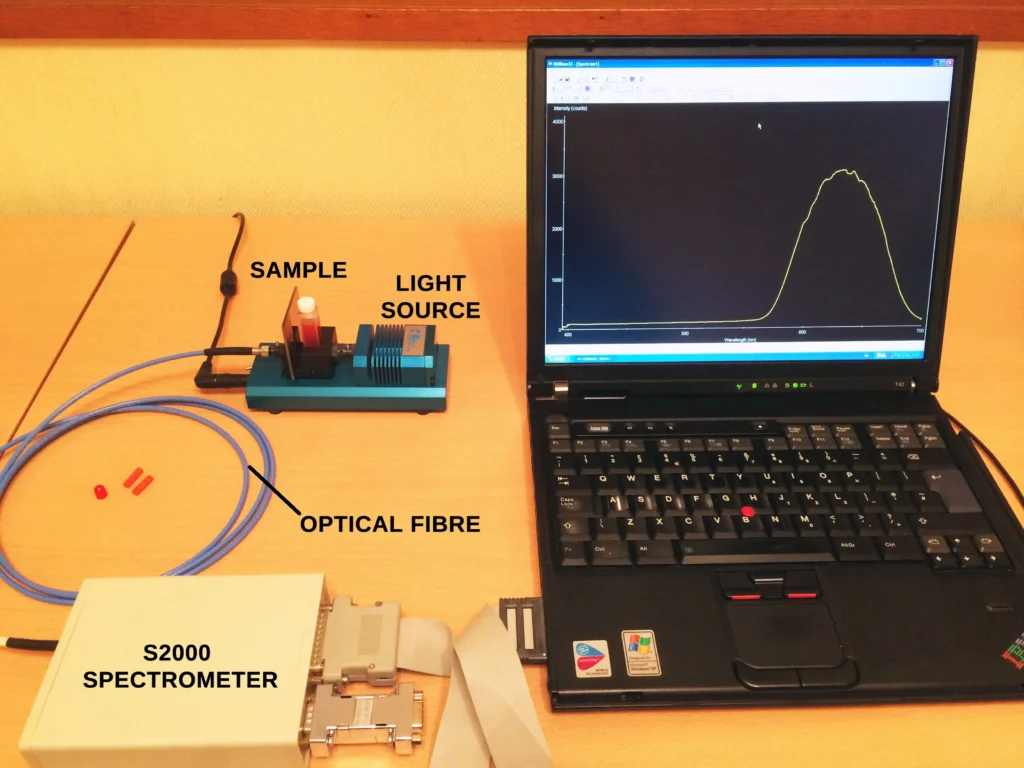
The experimental setup is shown below in Figure 4. This arrangement is similar to that used in the post on the Beer-Lambert law, but in this case the fluorescence signal is observed at right angles to the excitation light. This is standard practice for measuring fluorescence in the lab.
Calibration Standards
To conduct this experiment we first of all need to prepare some calibration standards. These are quinine solutions in dilute acid of exactly known concentration.
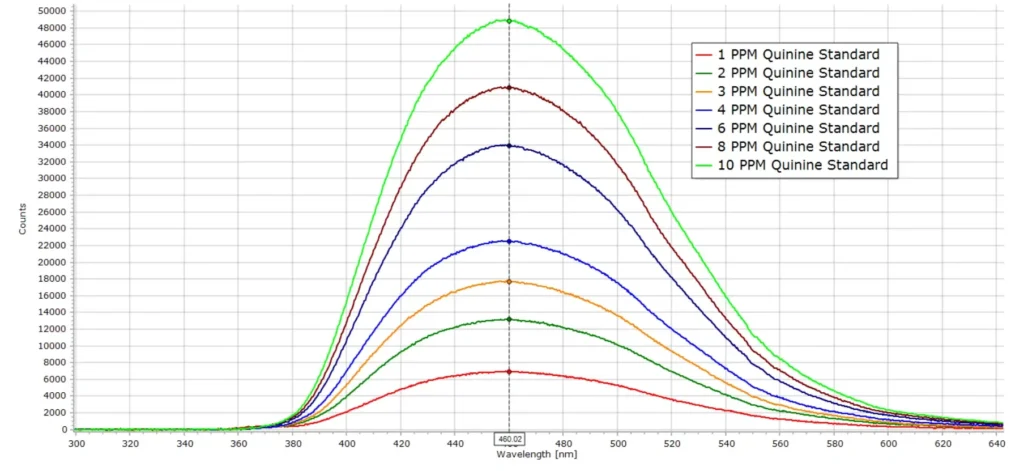
A series of standard solutions of quinine sulphate were prepared by preparing a stock solution of 100 mg/L (100 ppm) quinine sulphate in 0.1M sulphuric acid in a 250mL volumetric flasks. Appropriate quantities of this solution were then taken to make up standard quinine solutions of 1, 2, 3, 4, 6, 8 and 10 ppm quinine in 100mL volumetric flasks. The fluorescence spectrum for each standard was then recorded and produced the following series of spectra.
Strictly speaking, the Beer-Lambert law applies only to an absorption process, not fluorescence. But in the same way that the absorbance of a solution is directly proportional to the concentration of a chromophore, the fluorescence intensity is directly proportional to the concentration of the fluorophore, up to a certain point. The key phrase here is up to a certain point. Beyond this limit, deviations from linearity of the Beer-Lambert relationship occur if the fluorophore concentration is high enough. This is because a fluorophore can itself act as a chromophore and absorb light. The result is a reduction in the measured fluorescence intensity at high fluorophore levels, and this is known as the inner filter effect.
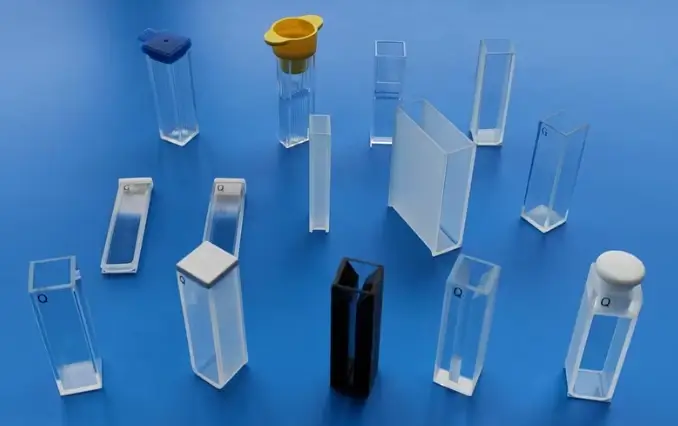
Because of this effect, a plot of fluorescence intensity versus fluorophore concentration will eventually deviate from a straight line relationship at a high enough concentration. The linearity of a Beer-Lambert plot can, in principle, be extended to a higher concentration range by shortening the path length through the sample. Recall that the degree of light absorption (or fluorescence in this case) is equal to ε c l, where l is the path length.
This is one reason why the manufacturers of spectrophotometric cells market a range of cuvettes with different path lengths, some examples of which are shown in this picture:
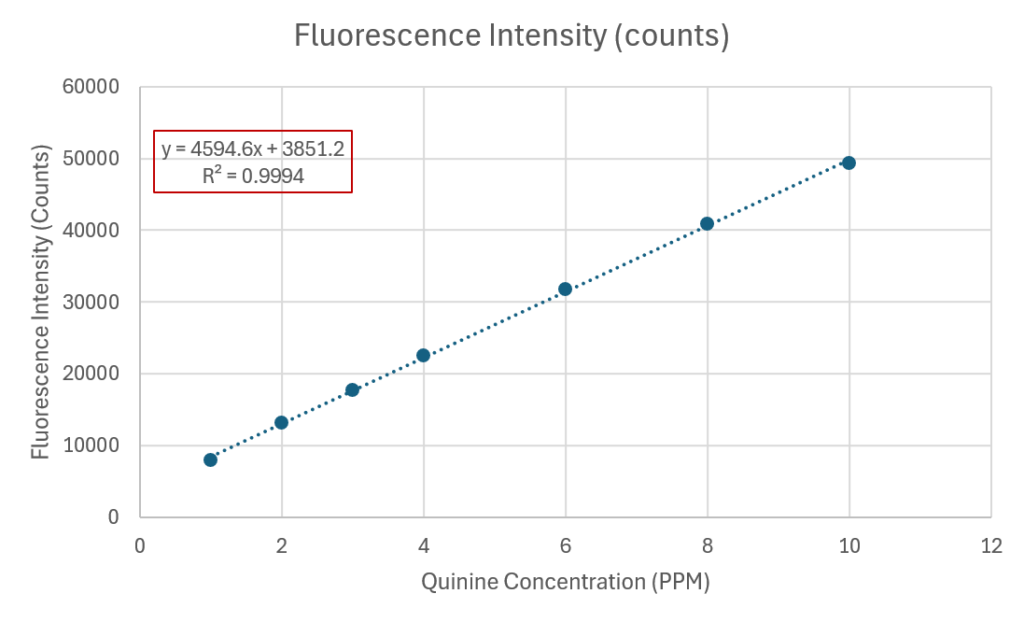
From the spectral data in Figure 5 we can construct a calibration curve, using intensity values taken close to the peak maximum wavelength at 460nm. This curve is depicted in below in Figure 6.
The calibration curve should be a straight line throughout the concentration range, which is indeed the case here. The equation of the line is given in the figure and the correlation coefficient R2 is very close to 1 at 0.994.
Tonic Water Sample
Having constructed the calibration curve, we can now measure the concentration of quinine in our sample of tonic water.
The samples were first shaken vigorously for several minutes to remove the CO2, the gas used in carbonated drinks. A 4mL aliquot of the sample was taken and diluted to 100mL in 0.1M H2SO4. The UV spectrum was then recorded with the setup in Fig. 4. Samples from two different tonic water cans were examined and the spectra recorded in triplicate.
From the spectra it is a simple matter to read off the fluorescence intensity at a λmax of 460 nm from the calibration curve. For three different tonic water samples with spectra recorded in triplicate, the results are summarized in Table 1.

Since we had diluted each tonic water sample by a factor of 25 ( a 4mL aliquot was taken and then made up to 100mL in acid), each value obtained from the graph has to be multiplied by this 25x correction factor to produce the actual concentration values shown in Table 1.
Conclusions
With a relatively simple spectroscopy setup for fluorescence, we have been able to determine the amounts of quinine in samples of a popular brand of tonic water. The measured concentrations in these samples are within permissible regulatory levels.

