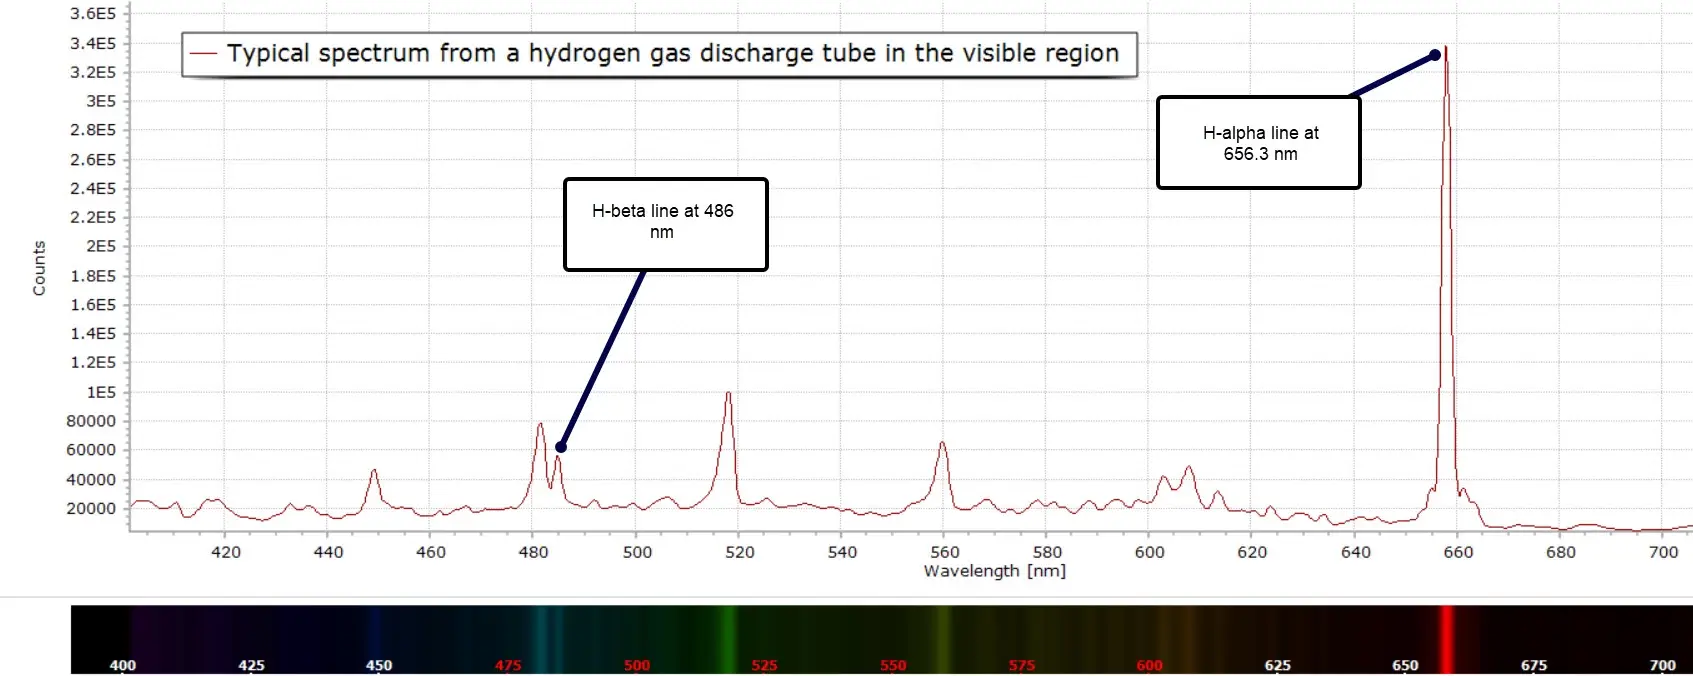
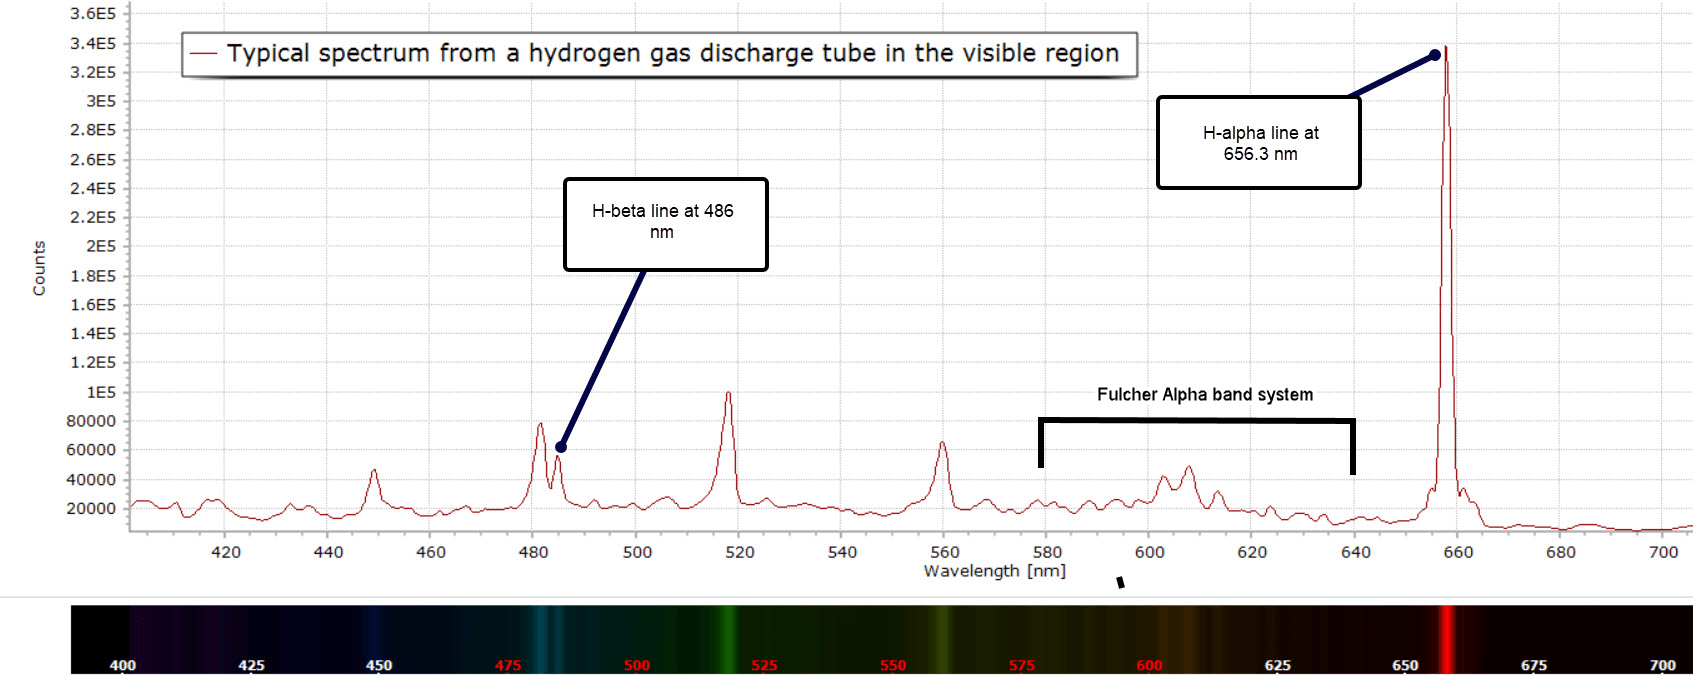
Here is the emission spectrum of hydrogen gas in a discharge tube recorded at moderate spectral resolution:
Fig. 1 The Spectrum of Hydrogen Gas in a Discharge Tube
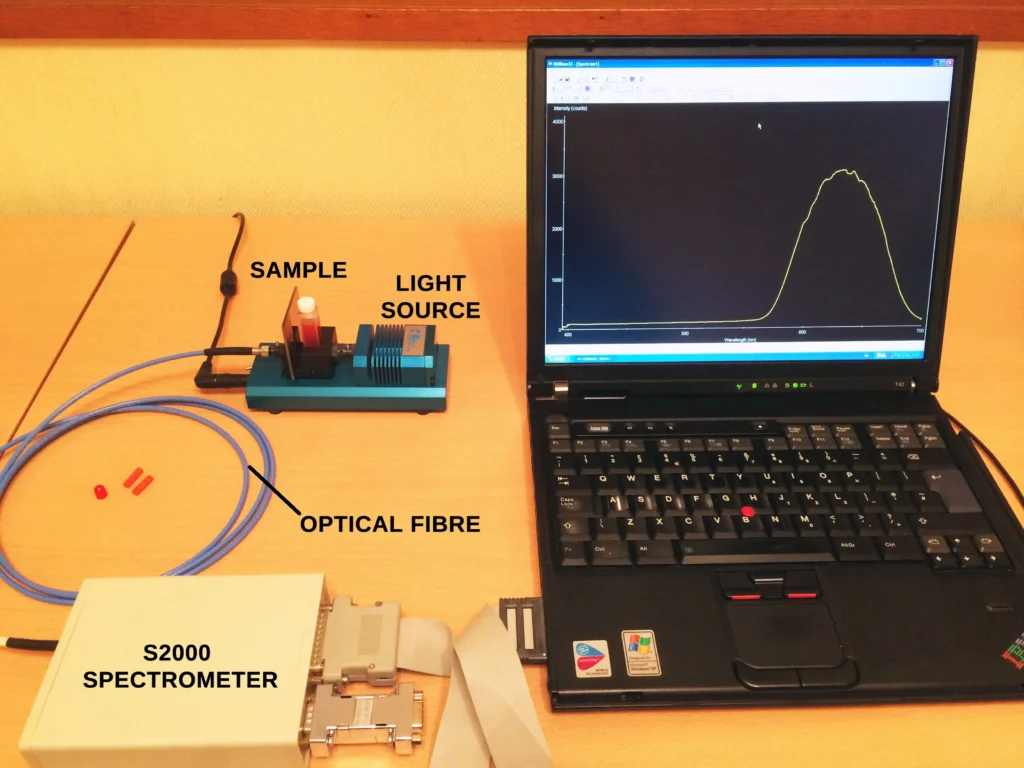
It was obtained, as with many other emission spectra on this blog, by using either a mini Tesla coil (widely available online) or a high voltage gas tube power supply. Both methods generate an electrical discharge in the gas sample. The light emitted is then fed into a spectrometer with an optical fibre.
Mini Tesla Coil
HV Supply
But there seems to be a problem… The emission lines observed look significantly different from those we see in chemistry or physics textbooks. When we are taught the basics of atomic spectra and the structure of atoms in high school and college, the emission spectrum looks something more like this example:
So what’s going on here?
Background
We all know that the hydrogen atom, with one proton and one electron, is the simplest of all the elements. We should therefore expect its emission spectrum to be just as simple. The answer is yes and no. If we look at atomic hydrogen emission lines across the whole electromagnetic spectrum, not just the visible in the above image, things can get slightly more complicated.
The first series of emission lines of atomic hydrogen were not surprisingly found in the visible region. They were discovered by the Swiss physicist Johann Balmer in 1885.
Balmer developed an empirical formula, after noticing that one emission line in particular (at 364.5 nm) had a very specific relation to every other line that was observed, as far as he could tell. From this he was able to predict the wavelengths of other lines in the visible that made up a series. In addition, Balmer was able to predict lines from other series that had not yet been discovered!
Balmer’s series of lines originate from transitions of the electron from an energy level n = 3 or greater to the lower energy level n = 2, where n is the Principal Quantum Number.
(The description we are using here is the simplified Rutherford-Bohr model of the hydrogen atom, with the nucleus – a proton in this example – at the centre and a single circulating electron in an “orbit” around it. Mathematically, this should be described by the wave function of the electron; however, the Bohr model is fine for our purposes here.)
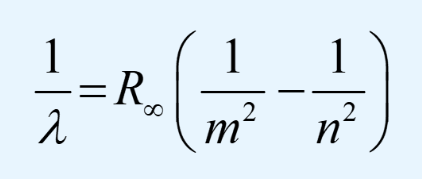
A few years later the Swedish physicist Johannes Rydberg developed a generalisation of Balmer’s formula with this expression that is in use today:
Here, λ is the wavelength, m is the level of a lower energy orbit for the electron, n is the level of a higher energy orbit for the electron and R∞ is a constant called the Rydberg constant and is equal to 109,677 cm-1.
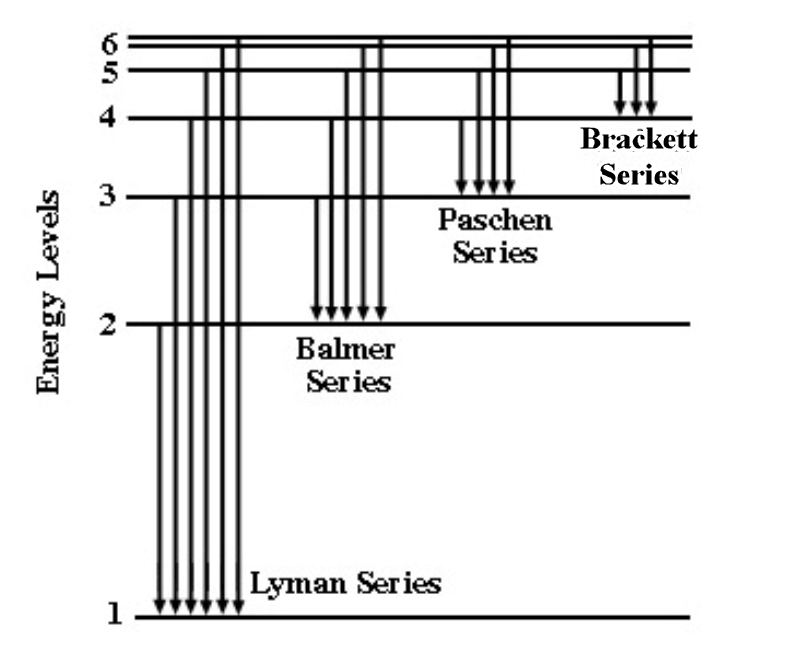
After the discovery of the Balmer series, similar sets of emission lines began to be identified outside the visible. These were the Lyman Series in the UV (discovered between 1906 to 1914), the Paschen series in the near infrared (found in 1908), the Brackett series (first observed in 1922), the Pfund series (2 years later) and the Humphreys series (much more recently in 1953). All are named after their discoverers.
The series continue with increasing values of m, following the same sequences of energy transitions, until a continuum is reached and the electron becomes free, unbound from the influence of the proton. However, the spectral lines rapidly become faint and undetectable because transitions from such high energy orbits become increasingly rare.
Fig. 2 Schematic Showing the First 3 Atomic Emission Series of Hydrogen
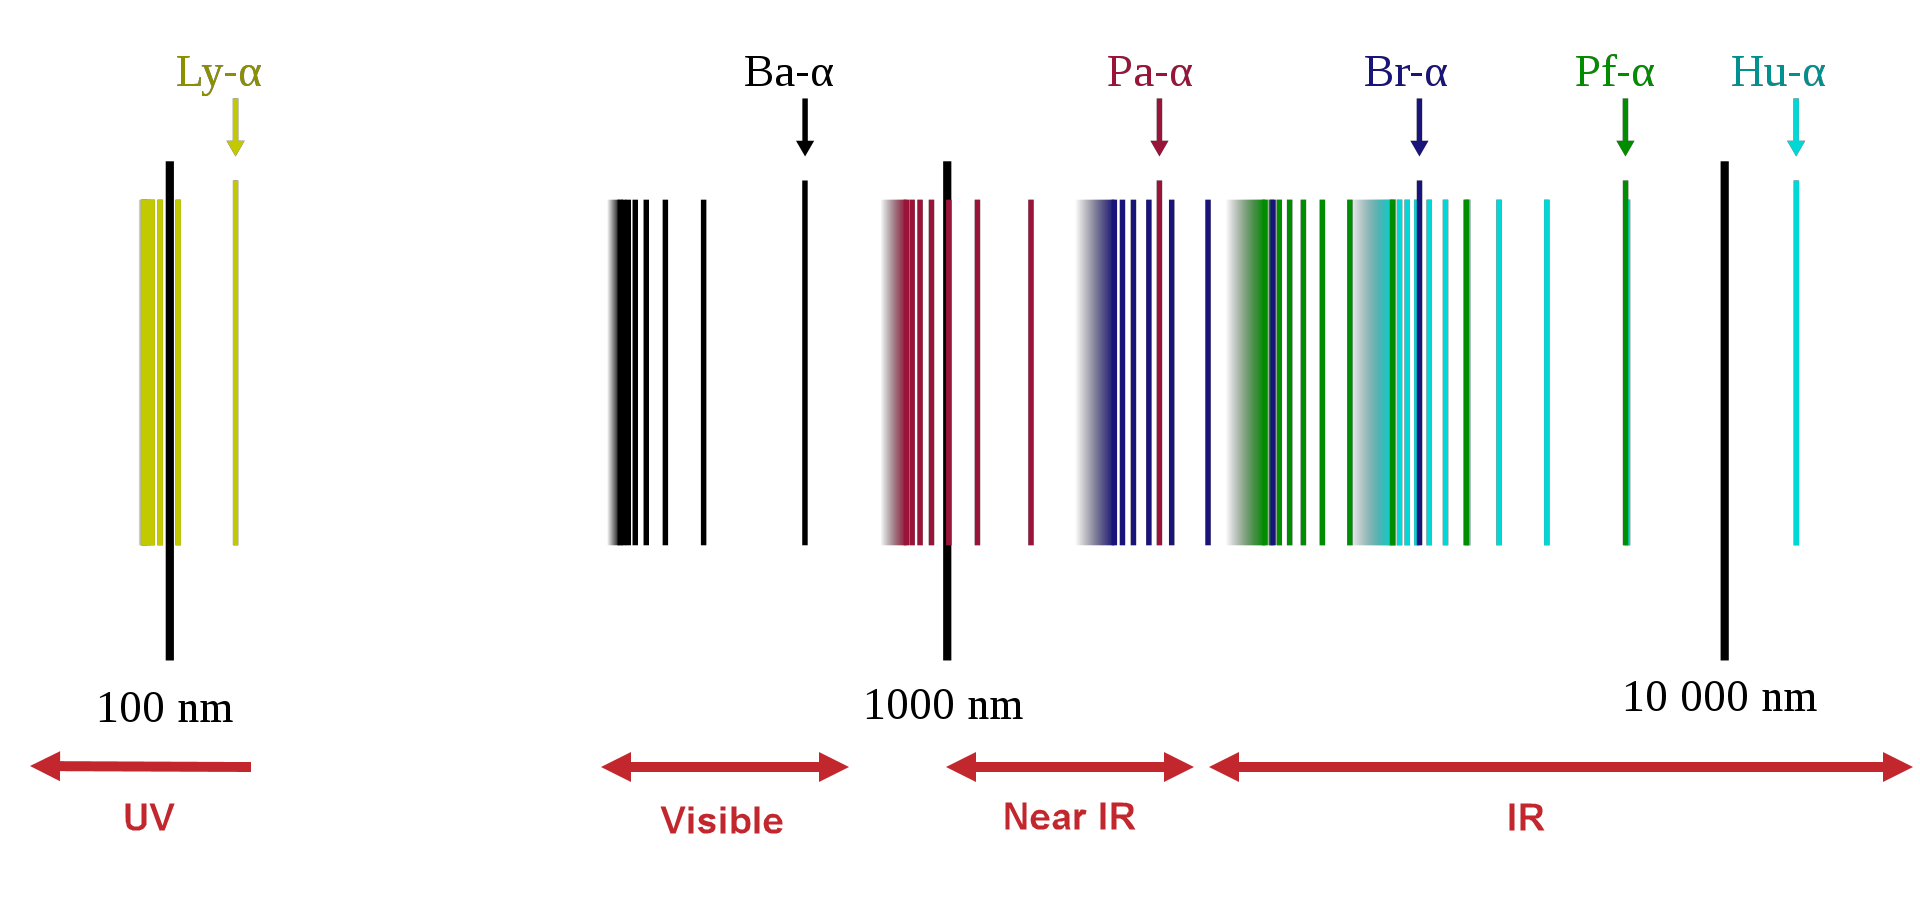
Fig. 3 Full Set of Series across the EMS
The different series are also often seen in a so-called Grotrian diagram that depicts the various electronic transitions between the energy levels in atoms that are allowed by quantum theory. Named after the German astronomer Walter Grotrian.
Fig. 4 Grotrian Diagram for Atomic Hydrogen
So although the hydrogen (or deuterium) spectrum is a little more complicated than expected because of these different series through the UV, visible and IR, the spectra are still well explained and very well understood.
So why does the emission spectrum recorded at the top of this post look so different? Why do we so many other lines?
The reason is that our gas sample is not mono-atomic!In the above discussion we have only been referring to atomic hydrogen. Hydrogen gas exists as diatomic molecules, H2, which are continually vibrating and rotating. As mentioned in other posts, the spectra produced by diatomic molecules have vibrational structure corresponding to energy transitions between different vibrational energy levels. And at higher resolution still, each vibrational band will exhibit rotational structure.
So when we pass a high voltage (several thousand volts) through the sample tube, an appreciable fraction of H2 molecules dissociate into atoms and are also ionized. The resulting gas sample (or plasma) consists of a mixture of hydrogen atoms in various excited energy states but also H2 molecules in different vibrational and rotational energy states as well. This is the reason the spectrum appears much more complex than expected, especially at high resolution.
Returning to the our experimentally measured discharge spectrum in Figure 1, the extra lines and bands are due to H2 molecules. The low intensity vibrational lines from about 580 – 640 nm are referred to as the Fulcher α band, discovered by Gordon S. Fulcher in 1913:
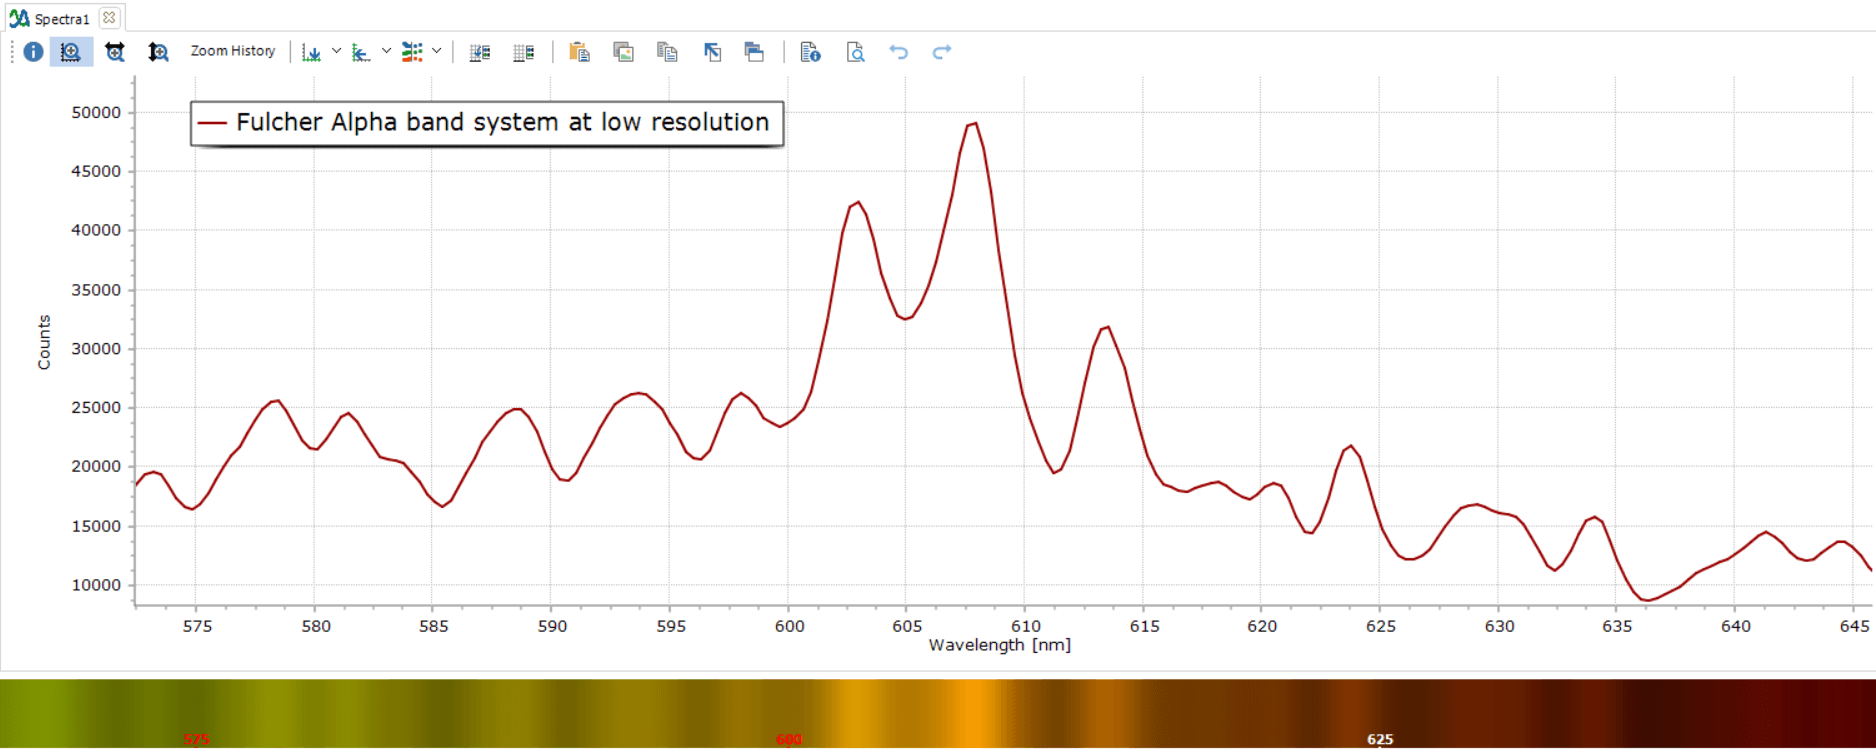
Zoomed in, the Fulcher α band looks like this at the rather modest resolution used:
Fig. 5 Vibrational band structure of the Fulcher Alpha band at low resolution
The Deuterium Lamp Spectrum
Deuterium is virtually identical to hydrogen apart from one neutron in the atomic nucleus, hence its other name “heavy hydrogen“.
A deuterium lamp is a common UV light source in physics and chemistry, particularly in UV-Visible spectrophometers and similar instruments. A deuterium lamp is a low pressure arc lamp that produces a continuous spectrum, superimposed with strong emission lines as shown here (from Deglr6328 at Wikimedia Commons):
When we examine more closely the Fulcher α band at higher resolution, using a 2400 lpm grating and 25 micron entrance slit to the spectrometer, a plethora of detail is revealed showing complex vibrational transitions in the spectrum of the D2 molecule.
Further details are available in Refs. 2 and 3.
Fig. 6 Fulcher Alpha System Detail
Final Words...
So although simple at first glance, the spectrum of hydrogen does hold some modest surprises, depending on whether we are observing purely atoms alone at low pressures, or both atoms and molecular species in an electrical discharge.
Today, spectroscopic investigations of the Fulcher bands under varying plasma conditions continue to be an active field of research in plasma physics and nuclear fusion research experiments.
References
Spectra of Low Potential Discharges in Air and Hydrogen, G. S. Fulcher, Astrophys. J., 37, 60 (1913)
Characteristics of Molecular Hydrogen and CH* Radicals in a Methane Plasma in a Magnetically Enchanced Capacitative RF Discharge, S. V. Avtaeva and T. M. Lapochkina, Plasma Physics Reports, (2007), 33, 774-785.
Optical emission spectroscopy measurements of hydrogen and argon plasmas at high resolution, M. Mazzaglia et al., Nuovo Cimento, 44 C, (2021), 58.
Dissociative recombination as primary dissociation channel in plasma chemistry, D. C. Schram et al., Journal of Physics Conference Series, 192, (2009), 012012.


Hola, disculpe, podría amplificar la gráfica del espectro emisor de 200 a 400nm. Por favor.
Hola, ampliaré el espectro de emisión de 200-400 nm y te lo enviaré lo antes posible. Debería poder hacerlo en los próximos días.
Hola de nuevo, adjunto el espectro de 200-400nm aproximadamente. En esta región, el espectro es esencialmente un continuo con muy pocas líneas.
Le enviaré los resultados por correo electrónico.
Steve
Muchas gracias,