In Part 2 of this article on the development of the infrared spectrometer, I covered the basic details of the Fourier transform version of the instrument – the FTIR.
In this final instalment, we look at some accessories that can be used with a modern day FT spectrometer, in order to handle a variety of samples – solids, liquids, thin films, creams, gels, gases, etc.
Managing Samples for FTIR Spectroscopy
Liquids
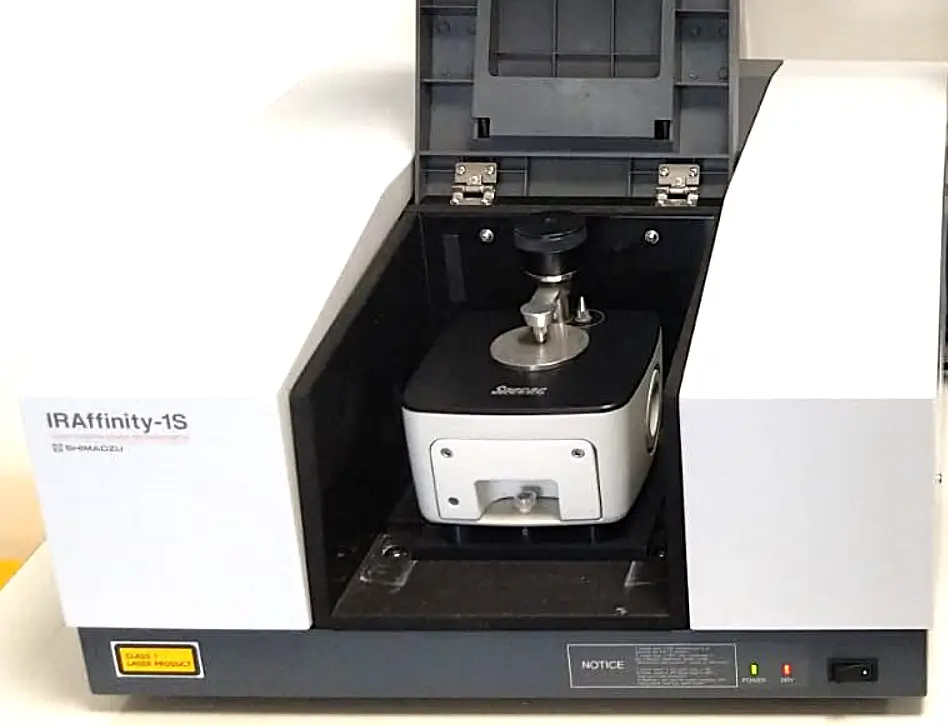
Modern FTIR spectrometers, while their actual footprint on the laboratory bench has been considerably reduced over the years, usually have a sample compartment that is mostly empty space. Designing the compartment in this way allows different accessories to be installed that can handle different types of sample of different sizes.
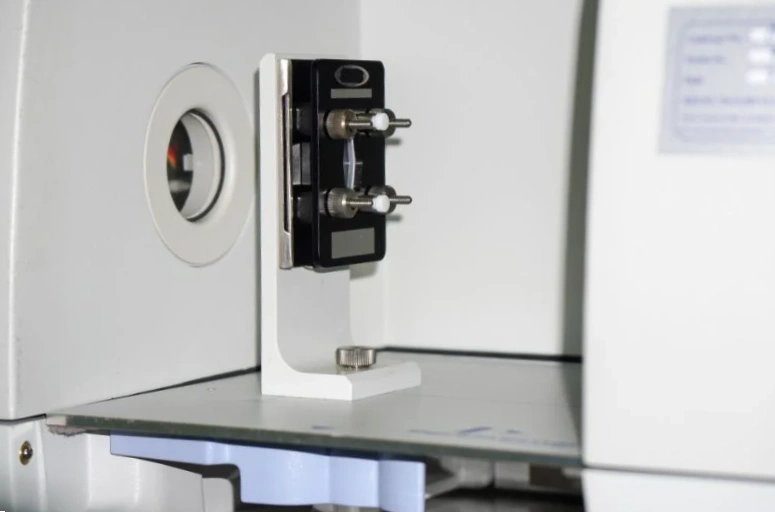
A good example is shown here:
Fig. 1 A typical holder for liquid samples
The black plate in the compartment is the sample holder and is used for transmission measurements. It has two KBr windows for holding a liquid sample, with the sample sandwiched between the plates and spread uniformly by capillary action.
Solid Samples – the Mull and the KBr Disk
Methods for preparing solid samples were adequately described in Part 1 of this article, using my own personal experience as a chemistry undergraduate in the 1970s. Used for many years before the advent of FTIR spectrometers, the mull and the KBr disc continue to be tried and tested methods to obtain a transmission spectrum of a solid sample in the mid-infrared. But they do require some experience in order to achieve a good spectrum. You ca refer to Part 1 of this article for more practical details on the KBr mull and disk.
Sampling by ATR
During the 1980’s, a new and rapid technique for recording an IR spectrum began to appear. It was a novel development that paralleled the increasing commercialization of FTIR spectrometers that was the main subject of Part 2. This new technique was Attenuated Total Reflection or ATR. Its enormous advantages in sample preparation were speed, simplicity and an amazing ability to handle liquids, gels, solids, thin film materials, essentially a large range of different materials that would otherwise have required lengthy preparation procedures. Together with a fast Fourier transform spectrometer, a useful IR spectrum can literally be produced in seconds.
So it is worthwhile exploring ATR in some detail, especially since ATR-FTIR spectroscopy has become the primary measurement method, largely surpassing transmission techniques.
Attenuated Total Reflection (or Attenuated Total Reflectance as it is also called) refers to a technique that sends infrared light from the source through a certain type of crystal (the ATR crystal) which is in intimate contact with the sample being investigated. The crystal used requires certain optical properties and criteria, the most important being that the refractive index of the crystal must be higher than the refractive index of the sample. If this condition is fulfilled, IR light from the source in the spectrometer will be internally reflected – it will bounce off the sample and travel back through the crystal.
So what’s the point, I hear you ask? If the light bounces off the sample, how is an IR spectrum of the sample ever produced? Total internal reflection cannot explain the interaction between the IR beam and the sample because the IR beam never leaves the ATR crystal. However, and this is the important point…the interaction of the IR beam and sample occurs through what is called an evanescent field, or evanescent wave. And the sample spectrum originates from this evanescent field.
The Evanescent Wave
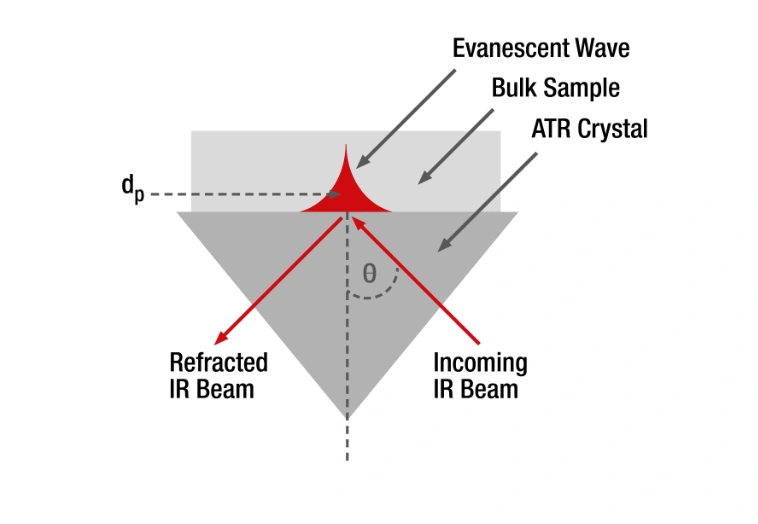
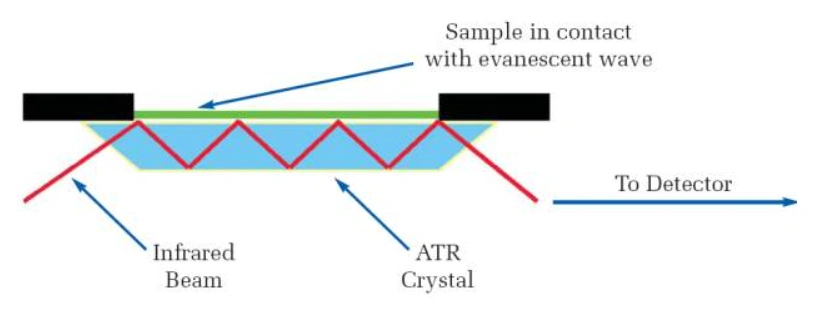
In optics, an evanescent wave is formed when waves traveling in a medium undergo total internal reflection at any boundary, as shown in this schematic diagram:
Fig. 2 Generation of an evanescent wave by an ATR crystal
In our example, the medium is the ATR crystal, and the boundary is the interface between the crystal and the sample.
Upon total reflection of the incident light at the interface, where the crystal touches the sample, a small fraction of the light actually extends into the sample as an evanescent wave.
Since this wave cannot propagate through the sample in the normal way, it is concentrated in close proximity to the spot where reflection back though the crystal occurs. However, the strength of the wave starts decaying exponentially (shown by the curved red “cone” in the above diagram). The end result is that the evanescent wave penetrates into the sample to some degree, where it is absorbed. This depth of penetration depends on the nature of the sample.
To summarize then, in the areas where the sample is in contact with the evanescent wave, specific parts of the IR beam are absorbed by the sample. The remaining reflected IR light that continues through the crystal has been reduced in intensity (attenuated), since some was absorbed by the sample. Hence the name of this technique “attenuated total reflection” (ATR).
More technical information on the evanescent wave and field can be found here.
The Penetration Depth
The penetration depth is a measure of how far the evanescent wave extends into the sample. Its exact value is determined by the wavelength of the IR light, the angle of incidence at the interface between the ATR crystal and the sample, and the refractive indices of the crystal and the sample.
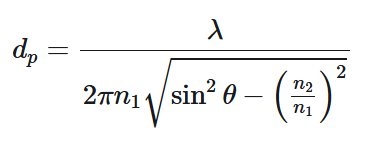
Formally, the penetration depth is defined as the distance to the point at which the intensity (amplitude) of evanescent wave has fallen to 1/e (about 37 %) of its original maximum value. It can be calculated from the following equation:
where λ is the wavelength of the light, n1 and n2 are respectively the refractive indices of the ATR crystal and the sample, and θ is the angle of incidence.
Three of the most popular materials used for ATR crystals are diamond, germanium (Ge) and zinc selenide (ZnSe). A summary of their properties is given in the following table:
Diamond
Germanium (Ge)
Zinc Selenide (ZnSe)
Spectral Range (cm-1)
45000 – 10
5000 – 600
20000 – 500
Hardness (Knoop Scale)
9000
550
130
Refractive Index
2.40
4.01
2.43
Penetration Depth (um)
1.66
0.65
1.66
Chemical Resistance
Very high
Medium-high
Low
A diamond ATR accessory is the ideal choice for a wide range of organic materials and samples. Since diamond is extremely hard and chemically inert, it is almost considered the universal ATR crystal and can be used to examine hard samples such as minerals. Its biggest disadvantage is its high cost. And it cannot be used for very dark samples with very high refractive indices.
A germanium ATR crystal excels at examining high refractive index samples, such as dark polymeric synthetic rubbers, because of its higher index of refraction. However, the penetration depth of the evanescent wave with a Ge crystal is much shorter, as indicated in the above table. Consequently, sample absorption is lower, and the signals are weaker. The shorter penetration depth, however, does make a Ge ATR crystal useful for selectively analyzing thin layers of a multiple layer sample, such as thin films and coatings. The useful spectral range is shorter than diamond and ZnSe crystals, but still very usable for the mid-IR.
A zinc selenide ATR crystal is a good compromise in terms of affordability and performance. It is well suited to many of the same applications used with a diamond ATR but has limitations in terms of its durability. ZnSe crystals can be easily scratched if the sample is too hard and it can only be used with samples within a relatively narrow pH range, typically pH 5-9. So if your sample is strongly acidic or alkaline, this will attack the ZnSe crystal, degrading its performance. Nevertheless, it is a popular choice for a limited budget.
ZnSe ATRs are available in what are called single-bounce and multi-bounce versions. As the name obviously indicates, these are crystals designed to produce a single reflection of the IR beam or multiple reflections of the beam.
An example of a single-bounce ATR cell was shown above in Figure 2. A multi-bounce cell is shown schematically below:
Fig. 3 Schematic for a multiple bounce ATR cell
Multi-bounce ATR crystals are very useful for handling liquids, gels and pastes of compounds, especially if the sample is only a very weak IR absorber. Because there are several (up to 12) reflections within a multi-bounce crystal, the IR signal accumulates and a useful signal from the sample can reach the detector. An example of a real multi-bounce ATR is shown here:
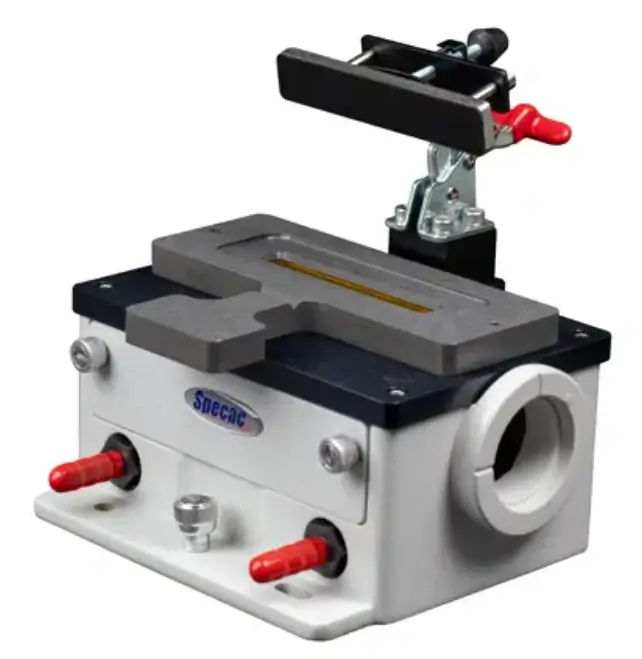
Fig. 4 A versatile multi-bounce ATR accessory
The top arm of the cell closes down onto the crystal to maintain good contact between sample and crystal. The crystal itself is the orange-brown coloured strip across the grey plate. This particular accessory has interchangeable top plates for liquids and soft solid samples as well as for flow-through and temperature-controlled experiments (courtesy of Spacac Corp. and used with permission).
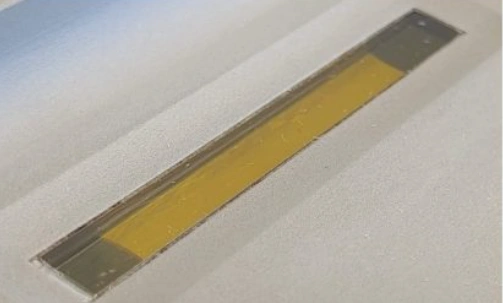
A closeup of a multi-bounce crystal can be seen here:
Fig. 5 A zinc selenide multiple bounce ATR crystal
The crystal lies at the bottom of a trough, which is typically 8-10 cm long, and the sample is simply poured or spread on top, followed by pressure being applied by the clamp to ensure good contact.
Differences between ATR and Transmission Spectra
One aspect to be aware of with the ATR technique was intimated earlier. An IR spectrum obtained by transmission and one obtained by ATR exhibit some differences.
This is because different wavelengths of IR light penetrate to different degrees in an ATR crystal, because they are refracted to different degrees. The higher IR frequencies (higher wavenumbers, cm-1) penetrate less than the lower frequencies. Remember equation 1 earlier – penetration depth is dependent on wavelength.
This variation between the different wavelengths of IR light causes some IR absorption bands in a sample to change in intensity, relative to a standard transmission spectrum. And in some instances, there can be a slight change in the actual frequency position in the spectrum.
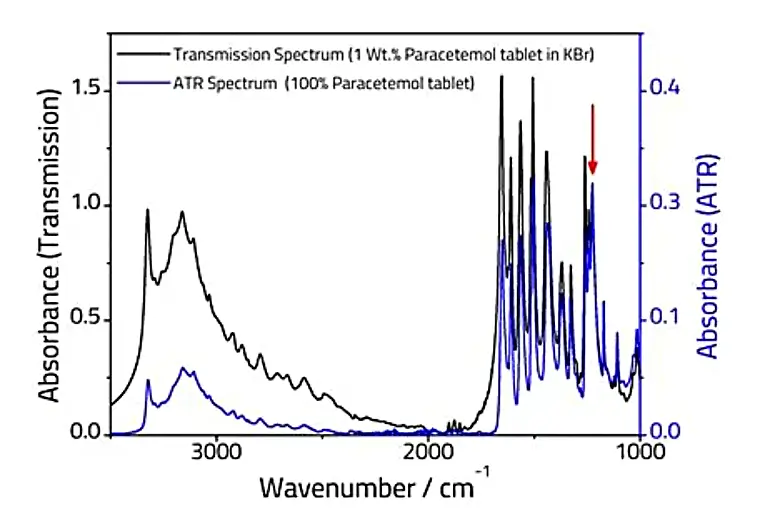
A clear example of this effect can be seen in these two spectra of a sample of a paracetamol (acetaminophen) tablet:
Fig. 6 IR spectrum of a paracetamol tablet measured by transmission and ATR
The two spectra above have been scaled so that the peak at 1230 cm-1 (indicated by the red arrow) has the same scale factor between transmission (left y axis) and ATR (right y axis). The effect of lower penetration depth at the higher frequencies with ATR is very noticeable.
Fortunately, these differences are easily corrected by modern computer software, and allow for spectra obtained by ATR and transmission to be directly compared.
DRIFTS
DRIFTS stands for Diffuse Reflectance Infrared Fourier Transform Spectroscopy. Quite a mouthful, I know, which is why we call it DRIFTS 😉. The principles of diffuse reflectance, and differences between diffuse and specular reflectance, have already been briefly covered here and here, in the context of visible light.
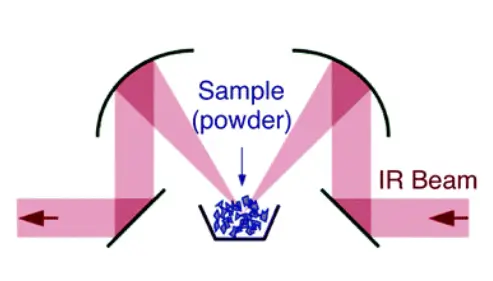
A DRIFTS sample accessory is useful for recording IR spectra of powders. The advantage is that a quantity of the powder is simply added to a small sample cup without any additional preparation. The IR spectrum is then recorded on the bulk sample – there is no ATR crystal, no concerns about penetration depth, only diffuse scattering of the IR beam from the sample under investigation, with scattered light usually being collected by an ellipsoid mirror, since the sample is scattering light in all directions.
A schematic outlining the IR beam path is given here:
Fig. 7 Beam path in a typical DRIFTS cell
If the powder absorbs too much IR light, it can simply be diluted and mixed with KBr, similar to the method of preparing a KBr disk (but without the die press). The only criterion to be aware of is that the particle size of the sample should be less than about 5 microns for mid-IR work in order to minimize Mie scattering.
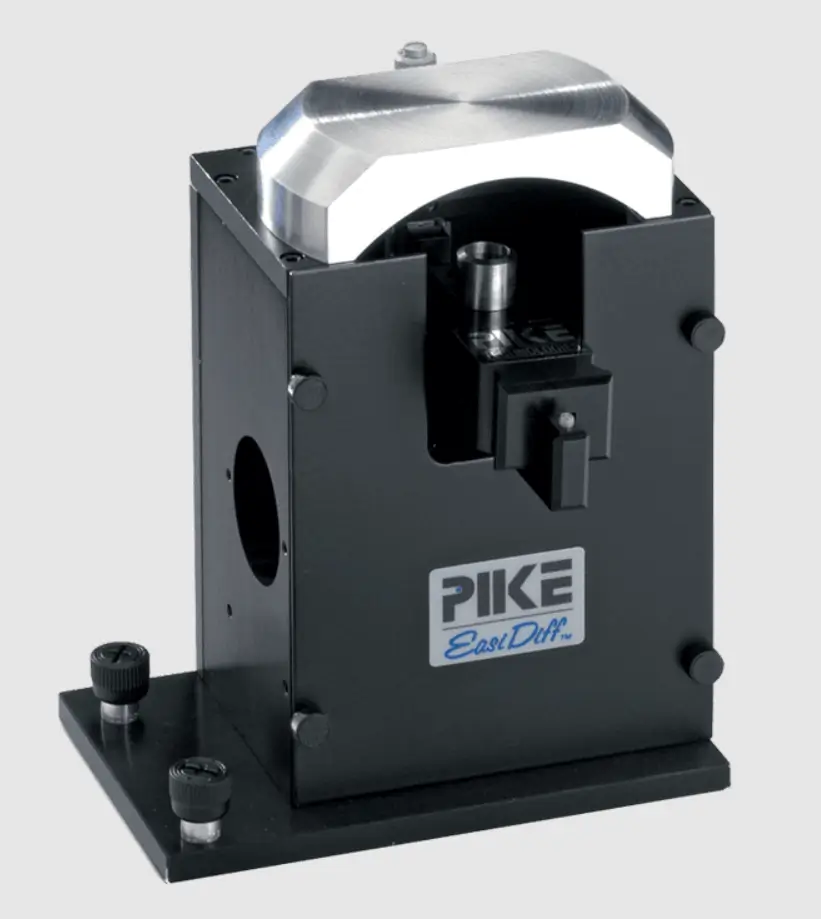
An example of a DRIFTS sample compartment is provided here (courtesy of Pike Technologies):
Fig. 8 Example of a typical DRIFTS cell for an IR spectrometer
At the start of this post, I pointed out that the sample compartment for an IR spectrometer, dispersive or Fourier transform, is largely empty space. Many of today’s manufacturers market different sampling systems that can simply be plugged into this empty space. Other third party suppliers sell various accessories that are compatible with spectrometers from the different manufacturers and that just require a few screws to install.
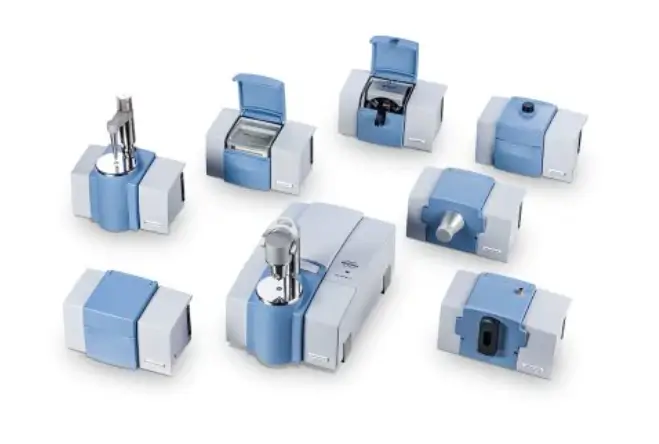
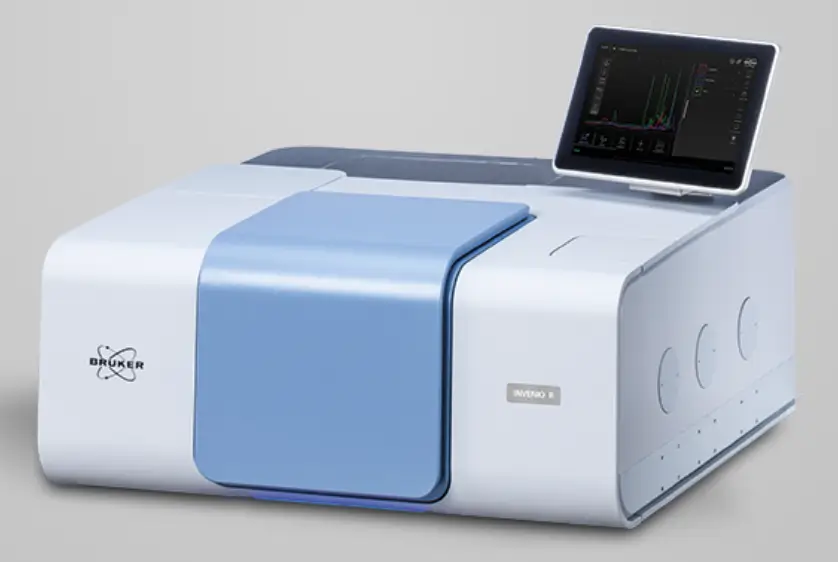
Examples of plug-in modules are shown here, in this case from Bruker with its QuickSnap™ system:
Fig. 9 Bruker's range of ATR accessories
The larger item in the above picture is the actual spectrometer. All the other units are interchangeable modules that can be plugged into the spectrometer, depending on the nature of the sample.
Final Words
This concludes this 3-post introduction to the Infrared Spectrometer, from its early days as a somewhat “temperamental” dispersive instrument, from my own personal experience 😆, to a simple and rapid Fourier transform spectrometer with many practical and useful accessories.
Future posts on IR spectroscopy will describe some results using a modern FTIR, the Bruker Alpha I with a single-bounce ATR cell.
8 Minute ReadIntroduction In Part 1 of this article looked at the development of the dispersive infrared (IR) spectrometer employing a grating monochromator and slits.…