In Part I of this post we briefly described some of the properties of the iodine molecule. The position of iodine in the Periodic Table and its electron configuration was outlined. This determines many of the physical and chemical properties of iodine and its reactivity. We then described some of the spectroscopic theory that is necessary in order to gain a basic understanding the iodine absorption spectrum in the visible region.
Recording the visible absorption spectrum of iodine vapour is, in fact, a popular and quite simple experiment to perform. It is regularly demonstrated in colleges and universities at postgraduate level. These institutions do have the budgets for relatively sophisticated (read expensive) instrumentation to produce a spectrum in a laboratory classroom setting.
Nevertheless, with some simple equipment that can be obtained online second-hand, the home experimenter can also produce a spectrum of usable quality that can then be analysed.
We now move on to the actual practical details.
Sample Preparation
First of all, obtaining a sample of iodine can present its own challenge. Too simplistic a search online by just typing “iodine” will inundate you with a plethora of sites attempting to sell you iodine health supplements or similar products containing some form of an iodine-containing compound!
Not exactly what we arelooking for! Therefore a Plan B is required.
The best approach is to search for “elemental iodine” or “iodine pellets”. You should then find quite a few sellers on a very well known auction site (we all know which one). Most of these sources are Chinese suppliers where shipping delays of a few weeks to destinations in Europe, North America and elsewhere are to be expected.
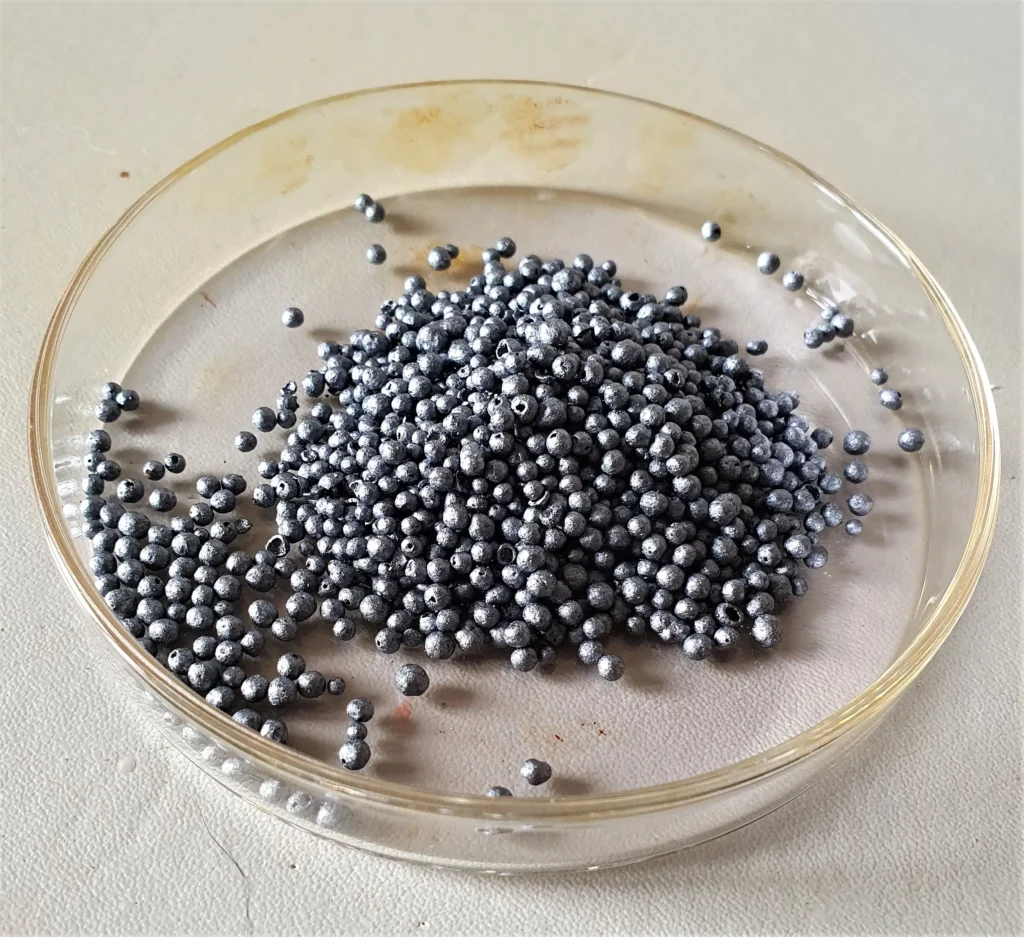
Nevertheless, these are perfectly reasonable sources of supply and offer elemental iodine samples of good purity. The sample we received was claimed to be iodine of 99.8% purity, although we have no technical means to verify this. Only a few milligrams of material will be needed, although these sources do sell larger quantities.
A typical sample of these iodine “pellets” can be seen here:
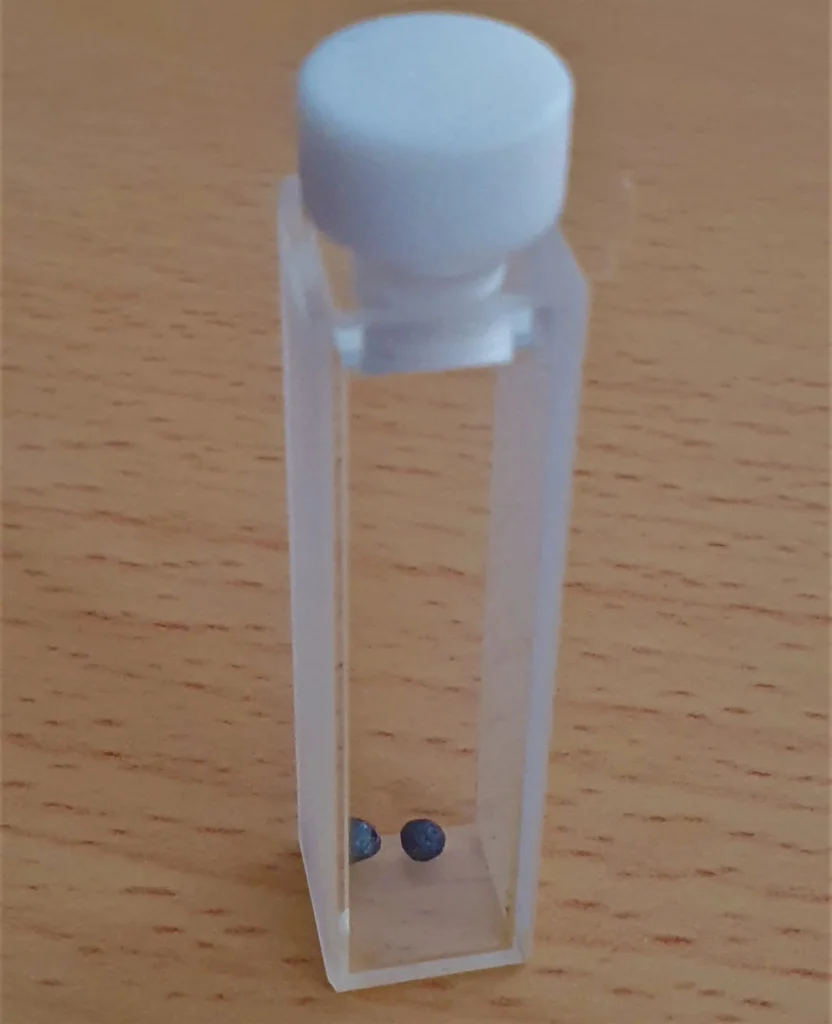
If required, fine needle-shaped crystals of iodine could be produced from a small sample of these pellets, by heating the material and immediately condensing the resulting vapour onto a cold surface. (This may tried sometime to check on purity.) But w took the easier way out here and placed 1-2 pellets directly in a 1 cm path length spectrophotometer cuvette as shown here.
Iodine pellets prior to heating
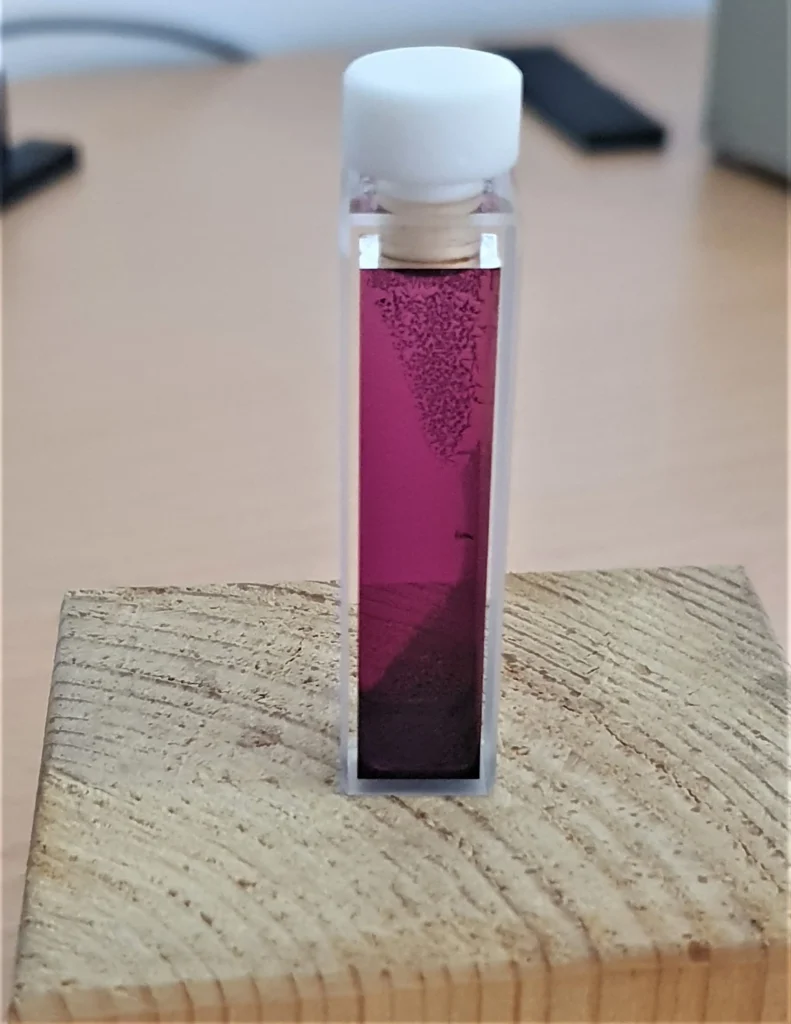
1-2 pellets of solid iodine are more than enough to produce enough vapour in the sample cuvette to record a spectrum. A small heat gun intended for paint stripping was used to heat the sample and this quickly produced enough vapour. A regular electric hair dryer would be just as effective but may take a little longer. Once enough I2 vapour is present in the cuvette (estimated visually), its spectrum can be recorded.
A typical image of gaseous iodine in the sample cuvette during the heating process is shown here:
Iodine pellets during the heating process to generate vapour
Experimental Setup
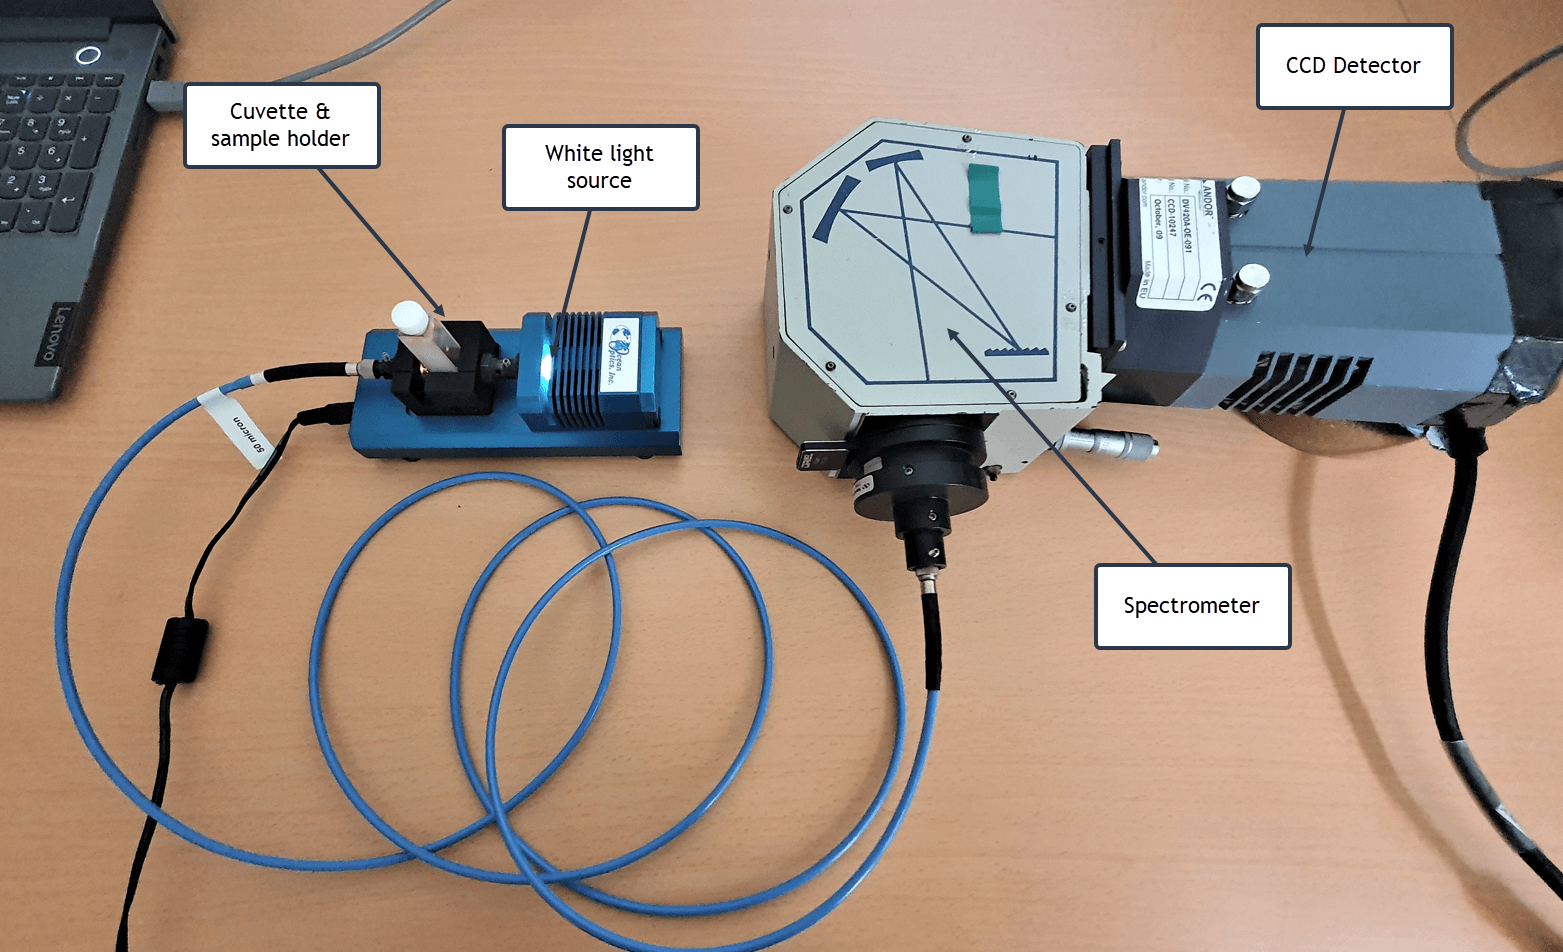
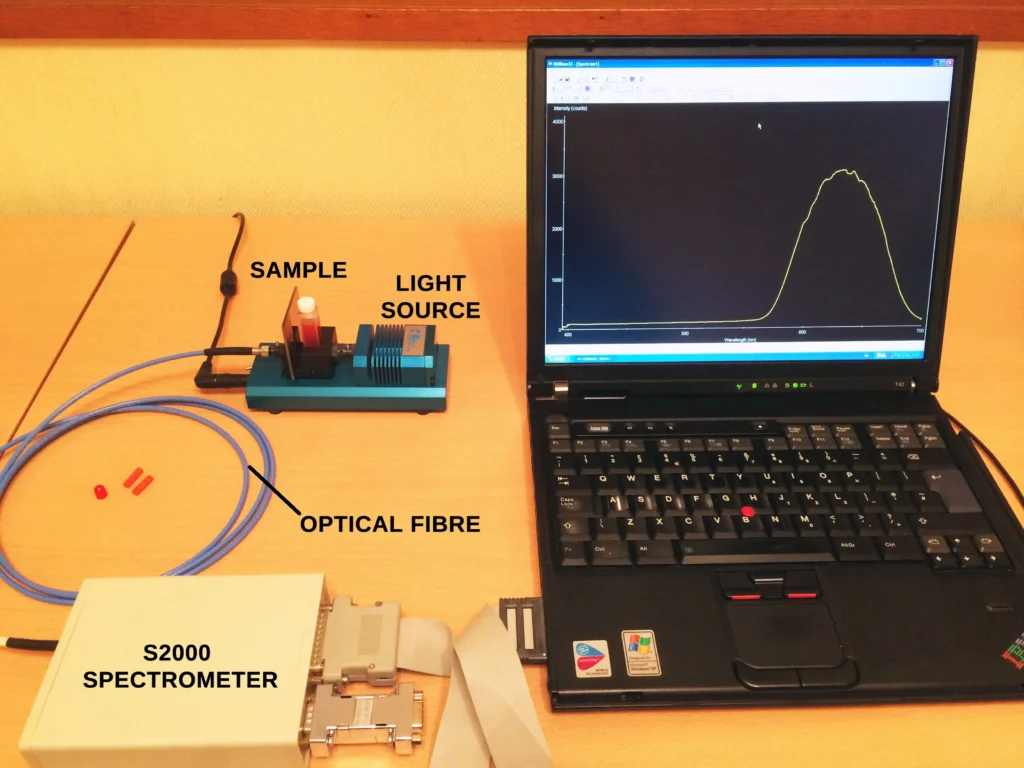
The experimental setup is very similar to several other posts on this site for recording absorption spectra of different materials. But in this particular case we need to heat the sample in order to get enough iodine molecules in the gas phase. A broad-band white light source (tungsten filament lamp or equivalent) was used to irradiate a 1 cm path length cuvette containing the sample. Absorbed light from the sample is then fed, via an optical fibre, directly into a spectrometer.
The setup is shown here:
Results
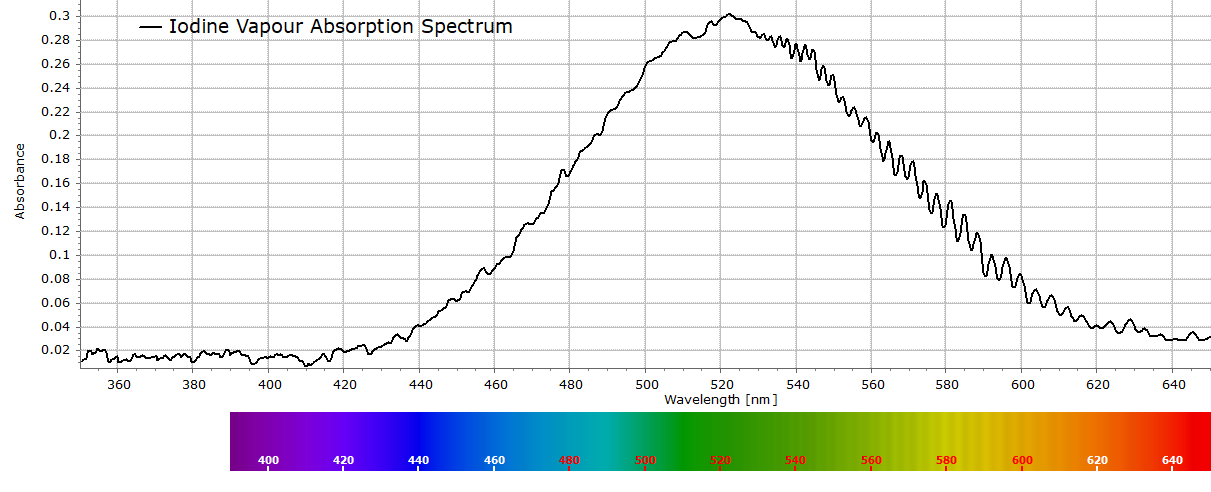
The raw unprocessed spectrum from this experiment can be seen below, together with a few explanations.
Figure 1. The Raw Iodine Absorption Spectrum
The data are background corrected and reported in absorbance units. A background signal was recorded first (i.e. no light enters the spectrometer). Then a reference spectrum was captured with an empty cuvette (this is just the spectrum of the white light source passing through the cuvette.) Finally, the sample spectrum was recorded with iodine vapour. Software automatically expresses the data in absorbance units. This is often a standard procedure when taking spectroscopic measurements in absorption.
The overall spectrum capture time was quite short: 500 x 1 millisecond exposures were automatically accumulated and integrated for a data acquisition time of only 0.2 seconds. This is typical for highly sensitive cooled CCD sensors that are used used in today’s modern solid state detectors.
In practice, the final acquisition time does take several seconds. This is because of the finite time needed for photoelectron charges (representing signal photon intensity) to be transferred to the CCD sensor’s on-chip amplifiers. Also, the time taken for the A/D (analogue-to-digital) conversion operation by the electronic circuitry adds an additional processing time.
More details of the operation of charge coupled devices (CCD’s) is readily obtained online by any standard sensor manufacturer or by an online search for CCD operation.
Data Processing
In the raw spectrum above (Fig. 1), we are principally interested in the region from around 530-610 nm that clearly shows the vibrational structure, although at the moment these are just small vibrational bands on a larger absorption envelope. In order to see these bands more clearly we perform a baseline correction on the raw spectrum over this region of interest to obtain the following spectrum that exhibits several well defined iodine vibrational bands:
Fig. 2. Detail of Iodine vibrational spectrum with peak maxima labelled
Data Analysis
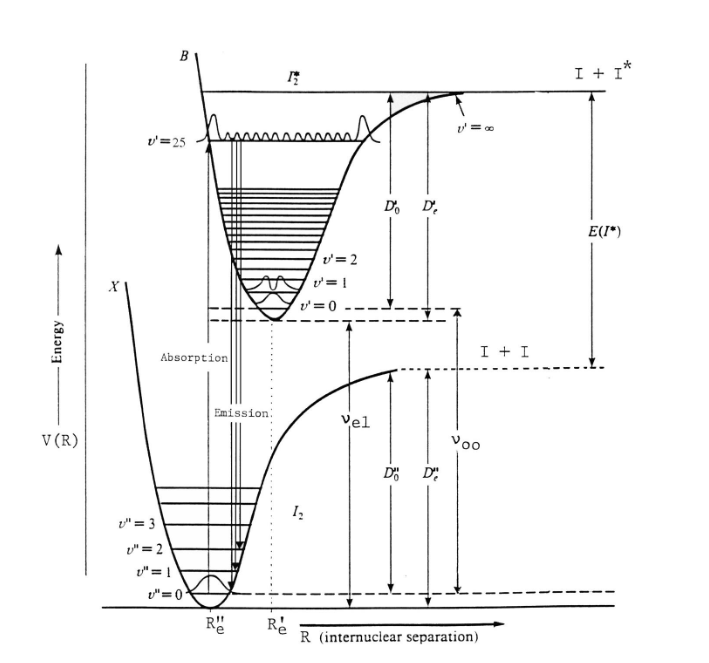
The actual electronic states that give rise to this spectrum are the X1Σg ground state and the B3Πu excited state. Conventionally, the lowest energy ground electronic state is labelled X and higher energy states are labelled A, B, C, etc… [For a detailed explanation of spectroscopic molecular term values and the energy states of diatomic molecules, here is a useful link.]
As mentioned in Part I of this two-part post, an electronic transition will also involve many changes in the various vibrational levels of the ground electronic state and the vibrational levels in the excited electronic state. Such energy changes are referred to as vibronic transitions. Again by convention, a vibrational level in the ground state is designated by υ” (double prime) and a vibrational level in an excited state is designated by υ’ (single prime).
Thus the energy difference for a vibronic transition will have a wavelength (or frequency in cm-1) given by
ν(υ”,υ’) = νelec + G(υ’) – G(υ”)
where νelec is the energy difference between the two electronic states at υ” = 0 and υ’ = 0.
This can be seen schematically in the diagram below for iodine:
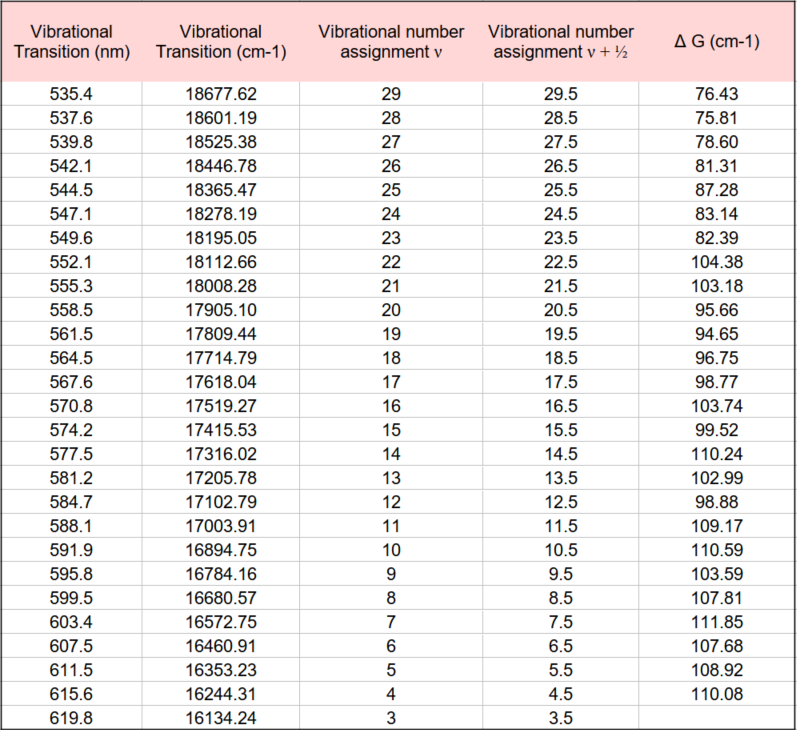
In order to proceed further with the analysis of the spectrum in Figure 2, we must assign the different vibrational peaks to their correct vibronic transitions (υ” → υ’). Fortunately, the frequency of the υ”=0 to υ’=25 transition has been measured very accurately by high resolution spectroscopy and reported in the literature. This transition is equal to 545.5 nm (or 18331.81 cm-1).
The closest observed wavelength to this value in our recorded spectrum in Fig. 2 is the band at 544.5 nm. This difference, relative to the value 545.5 nm, can be attributed to experimental error (which is always present in scientific measurements and may be due to uncertainties in the wavelength calibration of the spectrometer). 544.5 nm is therefore assigned to be the υ”=0 to υ’=25 transition. It is then a simple matter to construct the following table of vibrational assignments:
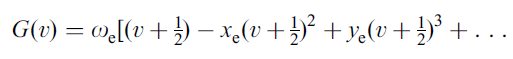
Now in Part I of this post, equation (6) describes the vibrational energy levels for an anharmonic oscillator as the power series expansion which is shown again here:
G(υ) is the energy in cm-1 of vibrational quantum state υ,ωe is the vibrational frequency in cm-1 and xe is the (first) anharmonicity constant.
Ignoring the cubic and higher terms in the above expression, the difference ΔG(υ) between successive vibrational energy levels will therefore by given by
This expression is the equation for a straight line. Values for G(υ) are obtained from measured values from the Fig. 2 spectrum and the table above. (The values must first be converted from units of nm to cm-1 before further calculations are performed.)
Then by plotting ΔG(υ) as a function of (υ + 1/2) the graph produced is a straight line with a gradient equal to -2ωexe and intercept on the y-axis equal to ωe. Furthermore, using equation (8) from the Part I post, namely
the bond dissociation energy D0 can be estimated.
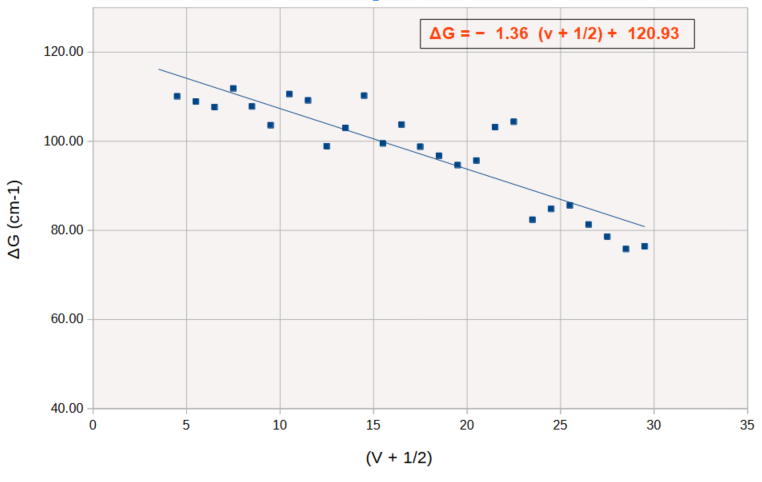
These results are reported in the following Birge-Sponer plot:
Birge-Sponer Plot of X-B Transition of Iodine from Vibrational Spectrum
The blue line is the least squares fit to the data obtained by regression. If the line is extrapolated to both axes the area under the line, as explained above, gives the bond dissociation energy D0.
We therefore obtain the following values:
D0 = 5429 cm-1 or 64.95 kJ/mol,
ωe = 120.9 cm-1
and xe, the anharmonicity constant, is obtained from the slope of the line and is equal to 5.62 x 10⁻³.
Conclusions
So with a relatively simple experimental setup, it is possible to determine the bond dissociation energy of molecular iodine, I2, its anharmonicity constant xeand oscillation frequency ωe . These parameters represent some of the fundamental physico-chemical properties of diatomic molecules identified during the last century that enabled further more detailed developments and progress in the field of spectroscopy and molecular structure.