Introduction
Magnetometers are instruments used to measure magnetic fields. They have been around in different forms since the great physicist and mathematician Karl Friedrich Gauss devised the first one almost 180 years ago.
Flux gate magnetometers are very useful devices that measure the change in magnetic field strength as a change in voltage or frequency. This very short video, courtesy of NASA Goddard, explains how they work:
Besides their intrinsic appeal to the home experimenter and the electronics hobbyist, fluxgate magnetometers have very useful applications in monitoring solar activity, for predicting the appearance of aurorae and, for example, for treasure hunters and beachcombers. In the last two examples, they are called gradiometers and use two sensors aligned with each other. This allows them to cancel out the Earth’s field and to see if there is another magnetic field around from a potential treasure source.
Quick Background to the Aurora and Space Weather
The science of space weather has become of increasing importance in recent years as our society becomes more and more technology dependent. Communications satellites, military defence satellites, space security systems of various kinds, GPS networks and even the ISS and other spacecraft, manned or unmanned, can all be affected by space weather and changes in solar activity.
So it is important to monitor solar activity continually in order to prepare adequately for what the Sun could send our way in the form of harmful electromagnetic radiation. If this sounds overly alarmist, you can read what happened during the Carrington Event in Wikipedia and also here. And then perhaps consider the implications for our highly dependent technology-driven society in this 21st century.
And to paraphrase this year’s excellent movie Oppenheimer, “the chances are [not quite] near zero!”
Any significant increase in solar activity from solar flares and coronal mass ejections (CME’s), if they happen to hit the Earth, can potentially have serious environmental and societal impacts. These events would have repercussions with immediate effect (within 2-3 days if a very large CME was to strike the Earth). This would have far more serious and immediate consequences than any slow and gradual variations from anthropogenic changes to our climate, that all the alarmist mass media and our global leaders keep trying try to propagate.
The terrestrial effects of space weather are considered a branch of space physics and aeronomy. They are concerned with the monitoring and measurement of the physical conditions in space that surround the Earth (and also elsewhere in the Solar System). Fortunately for all of us, the Earth possesses an effective magnetic field that makes it appear as if there is a large bar magnet at its centre. This field is aligned roughly north to south and, in most cases, affords good protection from any harmful electromagnetic radiation striking the Earth.
Our Sun too has its own magnetic field. This field creates a strong wind of high energy particles (mainly electrons, protons and alpha particles) that “blows” through the solar system. This solar wind is ionized and carries with it the solar magnetic field that distorts its classical shape as a dipole as shown in the image below.
When the solar wind meets the Earth’s magnetosphere (defined as a region surrounding the Earth where its field has an influence), it compresses the Earth’s magnetic field on the sunlit side. The field is strung out on the Earth’s night side into a long tail that is referred to as the magnetotail,
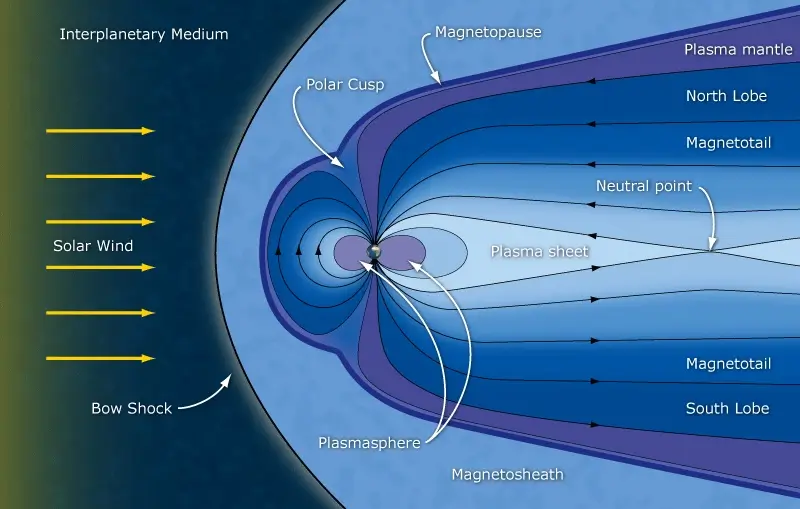
In the above picture, the Earth is that tiny globe in the middle, where all the action takes place.
As the Earth rotates about its axis each day, the distorted magnetosphere remains fixed relative to the Sun. So any point on the surface of the Earth experiences an alternate compression and extension of the local magnetic field during a 24 hour day as the Sun moves across the sky.
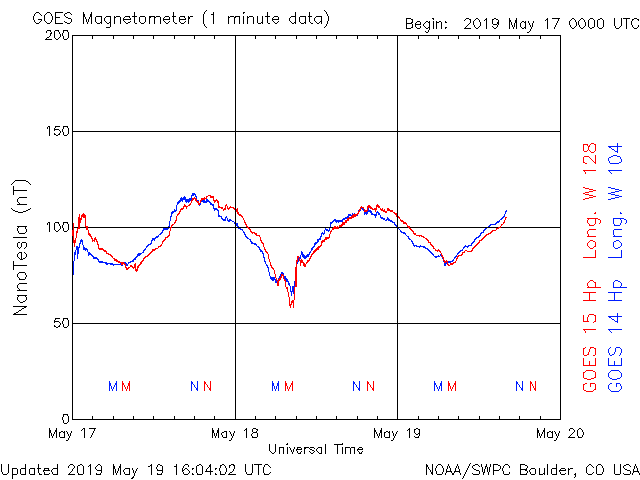
A magnetometer at any fixed measuring site on our planet therefore sees its local magnetic field change with time as the Sun moves through the sky. Any magnetometer will record this daily change in field intensity as a regular diurnal variation. These are considered normal, geomagnetically ‘quiet’ conditions. A typical recording showing this state of affairs can be seen here, from 2 geostationary GOES satellites:
Now the Earth’s magnetic field lines curve downwards as they approach the magnetic poles. If you recall your school physics experiments with iron filings and a bar magnet, where all the filings are clustered around the poles, then you’ve got the idea.
An active Sun causes turbulence in the solar wind that, in turn, results in turbulence near the Earth when the solar wind meets and interacts with the Earth’s magnetosphere. This turbulence is mostly caused by solar flares, coronal mass ejections (CME’s) and coronal holes. The Earth’s own magnetic field at ground level subsequently reacts and becomes distorted in response to this turbulence. This allows us to measure, to some extent, the level of solar activity. We need a magnetometer to monitor this activity, as we shall see.
When the Sun becomes highly active, this interaction of magnetic fields can become so large that field lines become entangled. What are called disconnection and reconnection events within the fields take place. These are magnetic storm conditions, where particles from the solar wind cascade down towards the Earth’s polar regions.
In the upper regions of our atmosphere (80-150km) at high latitudes, oxygen and nitrogen atoms are excited by these injected particles. The excited atoms then emit the light that we see as an Aurora – Borealis for the northern hemisphere and Australis for the southern hemisphere.
Red auroral light that we observe is due to high altitude excited oxygen atoms emitting at about 630 nm. Green auroral bands are due to excited O atoms at lower altitudes at 558 nm and blue bands are mainly due to both excited and ionized molecular nitrogen at 428 nm.
Under storm conditions the chart shown earlier (which is called a magnetogram) will look drastically different and something more like this, which was an actual magnetic storm that occurred 17-18 March, 2015:
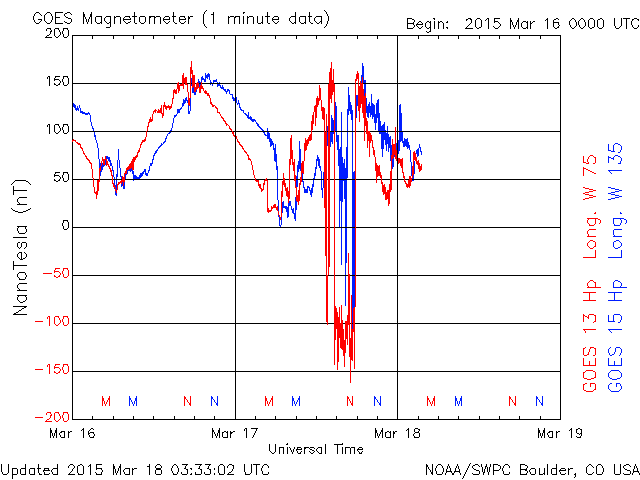
These charts are updated daily at NOAA’s Space Weather Prediction Center here.
So how can the home experimenter, and enthusiast detect and measure these field changes? One way is to use a flux gate magnetometer….
The Fluxgate Magnetometer
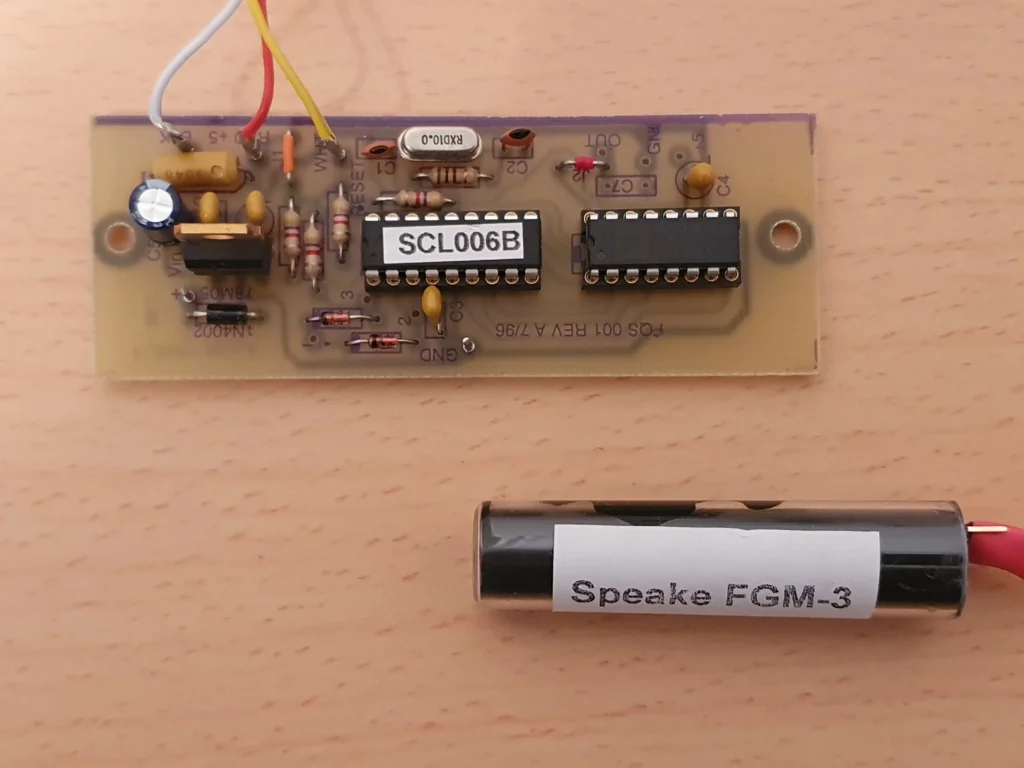
The short NASA video in the introduction gave us a quick explanation of how a fluxgate magnetometer works. Fluxgates have been around in different forms since the 1930’s. A popular one over the last 10 years or so has been the fluxgate sensor developed and marketed by Speake Electronics in the UK. This sensor became very popular with electronics enthusiasts and builders, curious about all things magnetic.
Sadly, the company owner and developer, Bill Speake, passed away in 2017. Fortunately, the business was sold to FG Sensors based in Slovenia. This company has developed the sensors further and maintained supplies. The “Pro” version of the sensor is now the FGM-3 and is popular among treasure hunters, geophysical scientists and other users.
That short NASA video earlier can be seen translated into real life below with this quick demonstration of a FGM-3 fluxgate sensor hooked up to an oscilloscope and frequency meter. Watch how the square wave output from the sensor changes in frequency as the sensor is rotated by about 90 degrees through my local geomagnetic field. This is captured on the oscilloscope trace (top instrument). You can also see these changes on the frequency counter (bottom right instrument).
And if a small bar magnet approaches the sensor the waveform and numbers change even more:
Next Steps
This frequency change is directly proportional to the change in magnetic field strength, which is usually measured in nanoTesla (nT). Any changes in field strength, as explained above, are related to changes in solar activity and, by implication, the chances of seeing an aurora at night.
In the second post for this project, we will outline the construction details for a single axis fluxgate magnetometer. This will describe how the home experimenter can monitor and record the fluxgate sensor’s output and send the data to a personal website or data logger.