Introduction
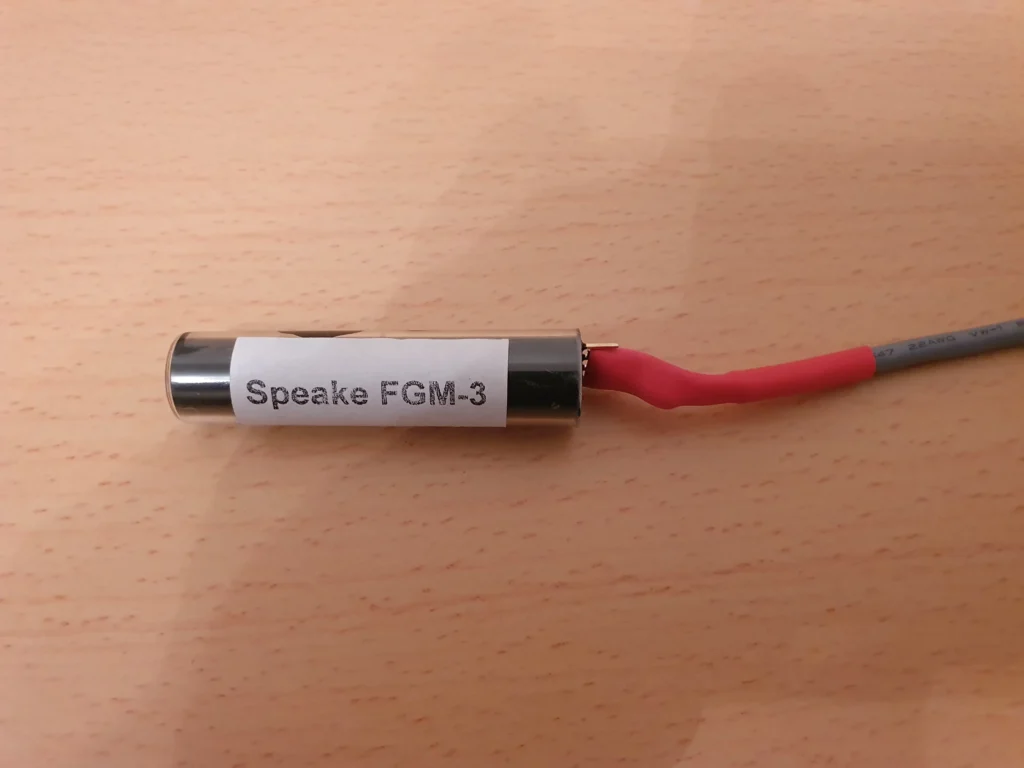
In Part 1 of this 4-part post, the fluxgate magnetometer (FGM) was introduced. We outlined how this device can be used to detect changes in the Earth’s geomagnetic field caused by the solar wind. These changes can predict, to some extent, the amount of solar activity and the chances of you seeing an aurora at your location.
A short demo of a fluxgate sensor in action was provided, showing how the frequency output from the sensor changes as it is rotated through the Earth’s magnetic field, or in the presence of a local field from a small magnet.
We now develop this project further by recording these changes in hardware and software. We will convert the frequency output from the sensor into a voltage and then into units of magnetic field strength in nanoTesla, nT. This is also known as the magnetic flux density. This conversion is performed in hardware and software using two very popular little devices: an Arduino microcontroller board and a Raspberry Pi minicomputer.
The final step will be to present live data from the FGM sensor that the home experimenter can send to a web page for real-time viewing. This will be described in a final post on this project.
Methodology
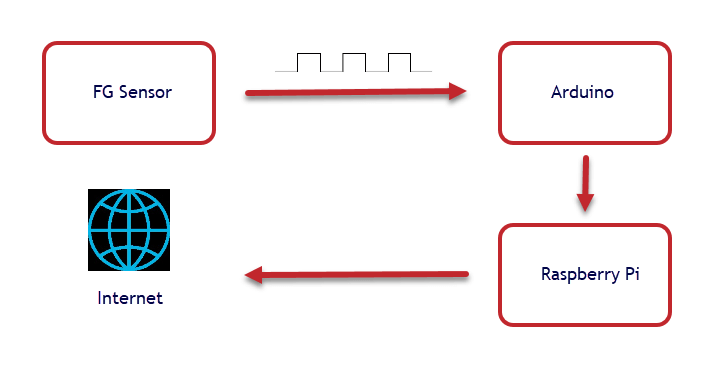
The overall hardware flowchart for these operations can be seen here:
The FGM Sensor
Starting with the FGM sensor first, here is a simple schematic from an original data sheet from Speake & Co. Ltd:
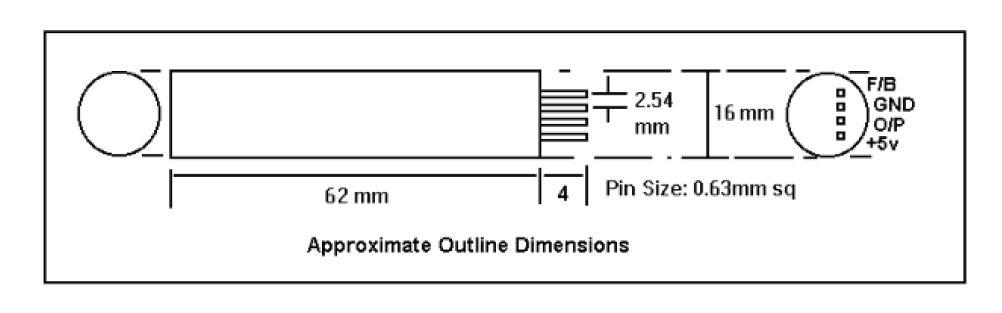
The original Speake sensor had 4 pins as indicated above, although the F/B pin (which meant “feedback”) is not used in this project. The newer FG sensors only have the 3 pins GND (ground), +5V and O/P (output).
The frequency output from the sensor is a square wave that varies from about 20kHz up to about 120kHz. As the sensor is rotated through the Earth’s magnetic field, a dramatic change in output frequency is observed as we saw in the video in the part I post.
Here are two static screenshots from an oscilloscope which show the frequency changes for my own sensor. In the first image, the sensor is orientated east-west where the Earth’s magnetic field exhibits its lowest values. A frequency of around 40kHz is displayed (red arrow).
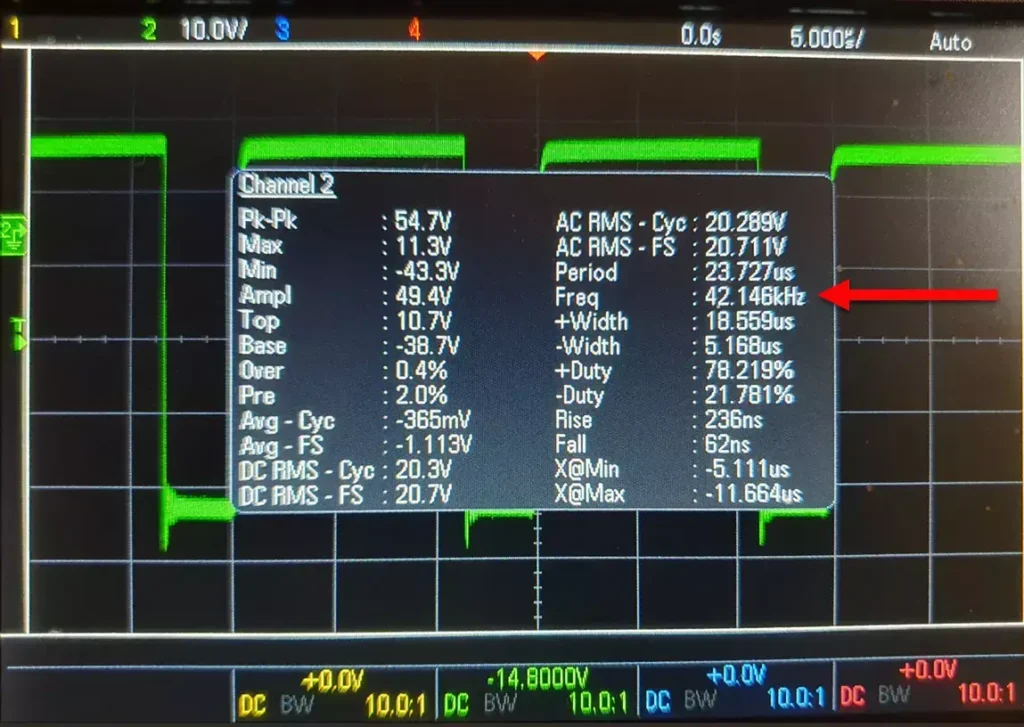
In this second image, the sensor is aligned north-south where the Earth’s field is the strongest and a frequency of about 110kHz is produced:
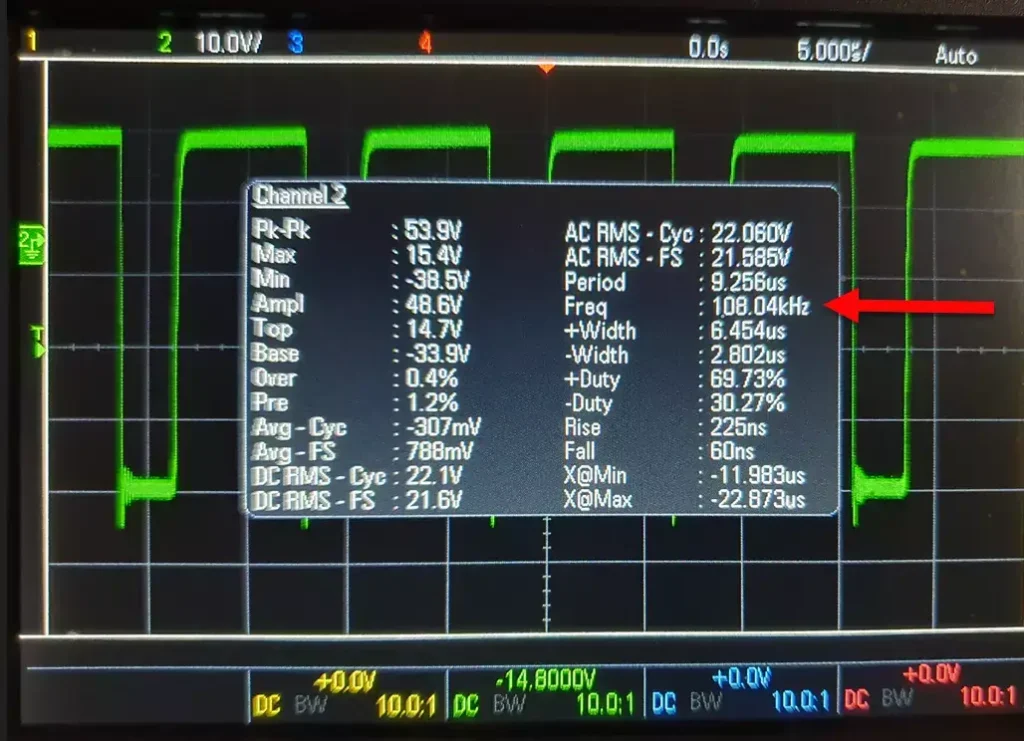
So this is the frequency range (40 – 110 kHz) that this sensor detects and that we will convert into units of magnetic field strength nT (nanoTesla).
The Arduino
The Arduino is an amazing and extremely useful microcontroller, costing around 30 dollars or so.
Invented by a group of Italian, American and Spanish developers back in the mid 2000’s, this credit-card sized circuit board has grown into a huge market with electronics hobbyists, gadget fans and enthusiasts everywhere. It appears in many schools, colleges and university STEM programmes to teach the basics of programming and electronics to students. Even the Large Hadron Collider at CERN uses Arduinos in some of its sub-systems!
I could go on and on about the Arduino and its potential applications. If you are curious about what it can do, an excellent starting point is to watch this Ted Talk video from one of the Arduino’s original co-founders, as well as exploring the official Arduino site.
The Arduino is a kind of ‘bare bones’ microcontroller chip on a development board. Arduino boards today come in various shapes and sizes, with different capabilities, from numerous suppliers because the architecture was made open-source with no commercial restrictions. The original Arduino UNO, which I shall use, is a few years old now but is perfectly adequate for this project and looks something like this:
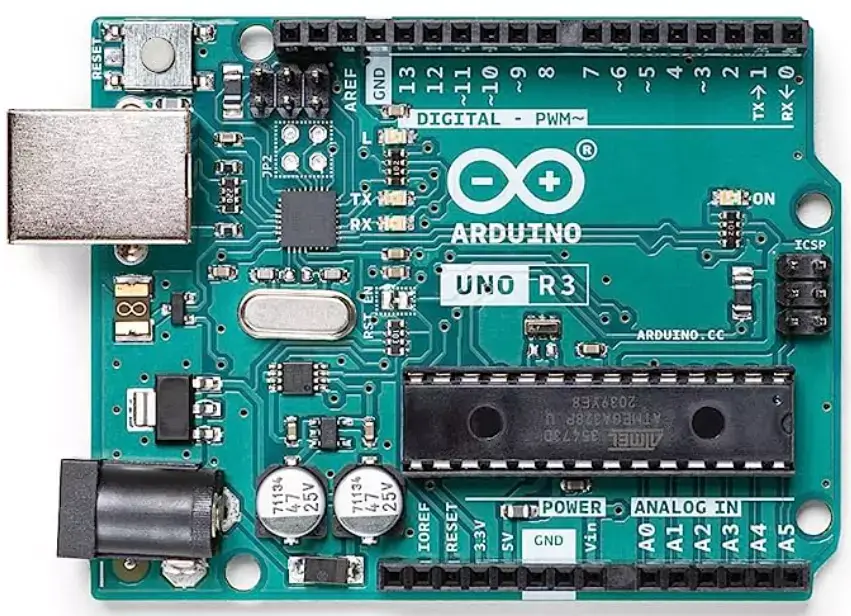
The Arduino is used to measure the output frequency from the FG sensor. We have to use an Arduino at this point in the project because the Raspberry Pi, while being a very capable microcomputer in its own right, is not designed to count the high frequency pulse rate (many kHz) directly from the FG sensor. So the Arduino plays the role of “intermediary”.
Setting up the Arduino
The software used to control and programme the Arduino can be downloaded for free from the official Arduino site. This control software and interface to the hardware is called the Arduino IDE (Integrated Development Environment) and is entirely open-source, therefore free.
A large number of tutorials are available on the official site, as well as on YouTube and elsewhere online, to get you started. These help the complete beginner to set up the IDE then load, compile and run their very own first programmes.
For this project, and in order to count square wave pulses coming from the sensor, an Arduino library called FreqCount is first installed. It is easily obtained by searching the libraries in the IDE or it can be downloaded. FreqCount is a small programme (only a few lines of C++ code) and is in the public domain. Its purpose, as the name implies, is to count the number of pulses (voltage changes) coming from some square wave frequency source in a given time period.
The code for FreqCount is given below. If you are totally new to programming, and this is all just gobbledygook to you, this code can just be copied & pasted, then compiled and run within the Arduino IDE:
/* FreqCount – Example with serial output
*http://www.pjrc.com/teensy/td_libs_FreqCount.html
* This example code is in the public domain.
*/
#include <FreqCount.h>
void setup() {
Serial.begin(57600);
FreqCount.begin(1000);/* gatetime in mSeconds*/
}
void loop() {
if (FreqCount.available()) {
unsigned long count = FreqCount.read();
Serial.println(count);
}
}
For setting up and initial testing, the Arduino can draw power from your laptop’s USB port and the sensor can be powered by a 6V battery. The FGM3 is not too fussy about the input voltage and 4.5V to 6V work fine. But you should be aware that the sensor’s output will vary if the driving voltage changes, as you would expect.
For installing in a permanent place in the house, it is best to use a stabilised dc supply. This could be purchased at low cost or constructed from a couple of voltage regulators and a few passive components on a piece of Veroboard.
A useful circuit (courtesy of Dr. Ian Robinson at starfishprime.co.uk) is shown here. This circuit will power the fluxgate sensor, the Arduino and a Raspberry Pi at the necessary voltages. It has the advantage too of using a common ground rail.
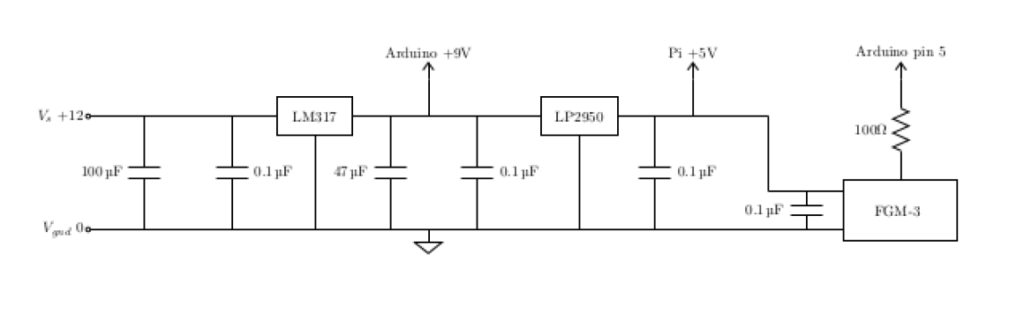
The voltage source is connected to the +5V and GND pins on the sensor and the frequency output pin (O/P) is connected to Pin 5 on the Arduino board. For an explanation of pin assignments and other functions on the board, it is best to check out the various basic tutorials on the Arduino site and elsewhere online. There are very many of them available!
Once all the connections have been made, compile and run FreqCount from the Arduino IDE. Start the Serial Monitor from the Tools menu and set the baud rate to 57600. The programme runs immediately and will continue to run until you exit.
This short video below (apologies for the quality) shows my laptop screen with the Serial Monitor (bottom window) logging the frequency rate every second (shown as 1000 milliseconds in the above code). When the sensor is rotated through 90 degrees (not seen in video) the frequency rate rapidly changes.
This is what we want. The circuit is working correctly!
Final Words
Both sensor and Arduino are now set up.
The final stage in this project is to set up the Raspberry Pi. This involves a number of different steps because we are going to get the Pi to save and process the data from the Arduino, to generate time-series plots, and then to upload the plots to a website.
So it’s slightly more complicated, but all the necessary details will be provided in the next couple of posts – hopefully coming soon!
Steve